
Fundamental Analysis: A Historical Investor's Guide
Investors who study market history quickly realize that sustainable success rarely comes from luck or timing alone. The foundation of informed investment decisions rests on understanding what companies are truly worth, not just what the market says they're worth at any given moment. This distinction forms the core of fundamental analysis, a methodology that has guided investors through bull markets, crashes, and everything in between for over a century. By examining financial statements, economic conditions, industry dynamics, and management quality, fundamental analysis provides a framework for separating genuine value from speculative hype, a lesson that proves remarkably consistent across different historical periods.
The Foundation of Fundamental Analysis
Fundamental analysis represents a systematic approach to evaluating securities by examining the underlying economic and financial factors that influence their intrinsic value. Unlike technical analysis, which focuses on price patterns and trading volume, fundamental analysis digs into a company's financial health, competitive position, and growth prospects to determine whether a stock trades above or below its true worth.
The methodology emerged in the early 20th century, gaining prominence through Benjamin Graham and David Dodd's seminal work "Security Analysis" published in 1934. Their principles, developed during the aftermath of the 1929 crash, emphasized the importance of analyzing financial statements to identify companies trading below their intrinsic value. This value-investing philosophy has influenced generations of successful investors, from Warren Buffett to modern fund managers who continue to apply these time-tested principles.
Core Components of Analysis
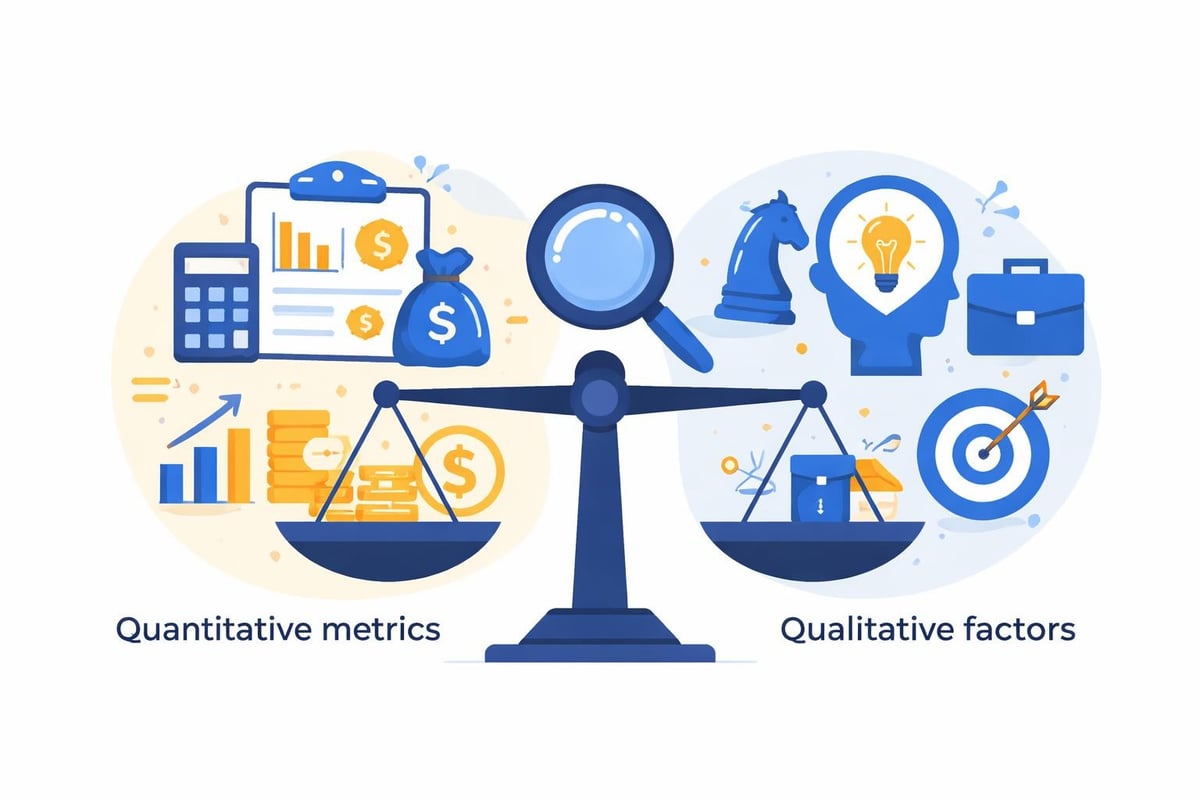
At its heart, fundamental analysis examines both quantitative and qualitative factors. The quantitative side includes measurable data from financial statements: revenue growth, profit margins, debt levels, and cash flow generation. The qualitative dimension encompasses harder-to-measure elements such as management competence, brand strength, competitive advantages, and industry positioning.
Quantitative Factors:
- Revenue and earnings trends over multiple periods
- Debt-to-equity ratio and other leverage metrics
- Profitability measurements including EBIT and operating margin
- Cash flow from operations and capital expenditure requirements
- Return on equity and return on invested capital
Qualitative Factors:
- Management track record and strategic vision
- Competitive moat or sustainable advantages
- Industry structure and regulatory environment
- Brand value and customer loyalty
- Innovation capability and R&D effectiveness
Financial Statement Analysis Through Time
Historical perspective reveals that financial statement analysis has always been the bedrock of fundamental analysis, though the availability and standardization of data have evolved significantly. In the pre-digital era, investors spent hours manually calculating ratios and comparing companies across different reporting standards. Today's analysts have immediate access to decades of data, yet the underlying principles remain unchanged.
The income statement provides insights into a company's profitability and operational efficiency. Examining revenue trends over multiple years helps identify sustainable growth versus one-time spikes. Gross profit margins reveal pricing power and cost management effectiveness, while operating margin shows how efficiently management converts sales into profits before interest and taxes.
Balance Sheet Deep Dive
The balance sheet offers a snapshot of financial position at a specific moment. Analysts compare assets against liabilities to assess solvency and capital structure. The debt-to-equity ratio indicates financial leverage and risk levels, while the quick ratio measures immediate liquidity without relying on inventory sales.
Historical analysis proves particularly valuable when examining balance sheets. Companies that maintained conservative leverage ratios during boom periods often survived subsequent downturns better than heavily leveraged competitors. The 2008 financial crisis demonstrated this principle clearly, as firms with strong balance sheets weathered the storm while overleveraged institutions collapsed.
| Financial Ratio | What It Measures | Historical Insight |
|---|---|---|
| Price-to-Earnings | Valuation relative to profits | Market cycles show P/E ratios expand in bull markets, contract in bears |
| Debt-to-Equity | Financial leverage | Lower ratios historically correlate with crisis survival rates |
| Interest Coverage Ratio | Ability to service debt | Companies below 2.5x often face distress during recessions |
| Return on Equity | Profitability efficiency | Sustained ROE above 15% indicates competitive advantages |
Cash flow statements complete the financial picture by tracking actual money movement. Free cash flow, calculated as operating cash flow minus capital expenditures, represents the true cash available to shareholders. Warren Buffett famously prioritizes this metric, recognizing that accounting profits can be manipulated while cash flows reveal operational reality.
Valuation Methods in Practice
Understanding what a company is worth requires more than analyzing its current financials. Fundamental analysis employs several valuation methodologies, each with strengths and limitations revealed through historical application. The tools of fundamental analysis have evolved, but core concepts remain consistent.
The discounted cash flow (DCF) model projects future cash flows and discounts them to present value using an appropriate rate. This approach works well for stable, predictable businesses but struggles with high-growth companies or cyclical industries where future cash flows vary significantly. Historical perspective shows DCF valuations often prove most accurate for mature companies with established track records.
Comparative Valuation Approaches
Relative valuation compares a company to similar businesses using multiples like price-to-earnings, price-to-book, or enterprise value-to-EBITDA. This method assumes the market prices comparable companies reasonably, making it faster than DCF but potentially flawed during market manias or panics.
- Identify truly comparable companies with similar business models, growth rates, and market positions
- Calculate relevant multiples using current market prices and financial metrics
- Analyze the distribution of multiples across the peer group to identify outliers
- Adjust for differences in growth rates, profitability, or risk profiles
- Apply appropriate multiples to the target company's metrics
Asset-based valuation examines a company's balance sheet to determine what shareholders would receive in liquidation. This approach, favored by Benjamin Graham, provides a margin of safety but often undervalues intangible assets like brands, patents, or network effects that drive modern company value.

Economic and Industry Context
Fundamental analysis extends beyond individual company metrics to examine broader economic and industry conditions that shape business performance. Historical market analysis demonstrates that even financially strong companies struggle during severe recessions, while mediocre businesses can thrive in favorable economic environments.
Macroeconomic indicators provide context for corporate performance. Interest rates affect borrowing costs and discount rates used in valuations. GDP growth rates indicate overall demand conditions. Inflation impacts pricing power and input costs. Understanding these relationships helps analysts project future performance more accurately.
Industry structure fundamentally influences profitability potential. Michael Porter's Five Forces framework analyzes competitive intensity, supplier power, buyer power, threat of substitutes, and barriers to entry. Industries with favorable structures, such as oligopolies with high barriers to entry, generally support higher profit margins than fragmented, competitive markets.
Key Industry Considerations:
- Growth trajectory and market maturity stage
- Regulatory environment and potential changes
- Technological disruption risks
- Cyclicality and correlation to economic cycles
- Capital intensity and return requirements
The interaction between economic cycles and industry dynamics creates opportunities and risks that fundamental analysis seeks to identify. During the dot-com bubble, many analysts overlooked traditional valuation metrics, focusing instead on new paradigms that proved unsustainable. Historical perspective reminds us that fundamental principles ultimately reassert themselves, regardless of temporary market enthusiasm.
Historical Patterns and Market Lessons
Studying financial markets through a historical lens reveals recurring patterns in how fundamental analysis principles apply across different eras. The railroad boom of the 1870s, the 1929 crash, the 1970s stagflation, the 2000 tech bubble, and the 2008 financial crisis all offer distinct lessons about the importance of rigorous fundamental analysis.
Companies with strong fundamentals, characterized by low debt, consistent profitability, and sustainable competitive advantages, have historically outperformed during market downturns. Shareholder returns over decades correlate more strongly with fundamental business performance than with short-term price movements or market sentiment.
Learning from Market Extremes
Market manias typically feature widespread abandonment of fundamental analysis in favor of momentum trading and speculative narratives. The late 1990s saw investors value internet companies with no earnings at astronomical multiples, ignoring basic valuation principles. When the bubble burst in 2000-2002, companies lacking solid fundamentals collapsed while those with real profits and cash flows eventually recovered.
Conversely, market panics create opportunities for fundamental analysts. The 2008-2009 financial crisis pushed many high-quality companies to valuations well below their intrinsic value as indiscriminate selling dominated. Investors who applied fundamental analysis to identify solid businesses trading at distressed prices generated exceptional returns as markets normalized.
| Historical Period | Market Condition | Fundamental Analysis Lesson |
|---|---|---|
| 1929-1932 | Great Depression | Leverage magnifies downside; liquidity matters |
| 1973-1974 | Stagflation Bear | Quality companies recover faster from shocks |
| 1999-2000 | Tech Bubble | Earnings eventually matter; growth without profits fails |
| 2008-2009 | Financial Crisis | FDIC protection and government support change outcomes |
The efficient market hypothesis suggests that stock prices reflect all available information, making fundamental analysis futile. However, historical evidence shows markets regularly misprice securities, particularly during emotional extremes. Behavioral biases, information asymmetries, and institutional constraints create opportunities for diligent fundamental analysts to identify mispriced securities.
Practical Application for Modern Investors
Implementing fundamental analysis requires access to reliable data sources and systematic processes. Top sources for fundamental analysis data include company filings with the SEC, financial databases, industry reports, and economic statistics from government agencies.
Modern technology has democratized access to information that was once available only to professional investors. Platforms now provide decades of financial data, allowing individual investors to conduct the same rigorous analysis as institutional analysts. This historical depth enables pattern recognition and trend identification impossible for those examining only recent quarters.
Building a fundamental analysis framework starts with defining investment criteria based on your risk tolerance, time horizon, and return objectives. Value investors might screen for low price-to-book ratios and high dividend yields, while growth investors focus on revenue acceleration and market share gains. Both approaches rely on fundamental analysis but emphasize different metrics.
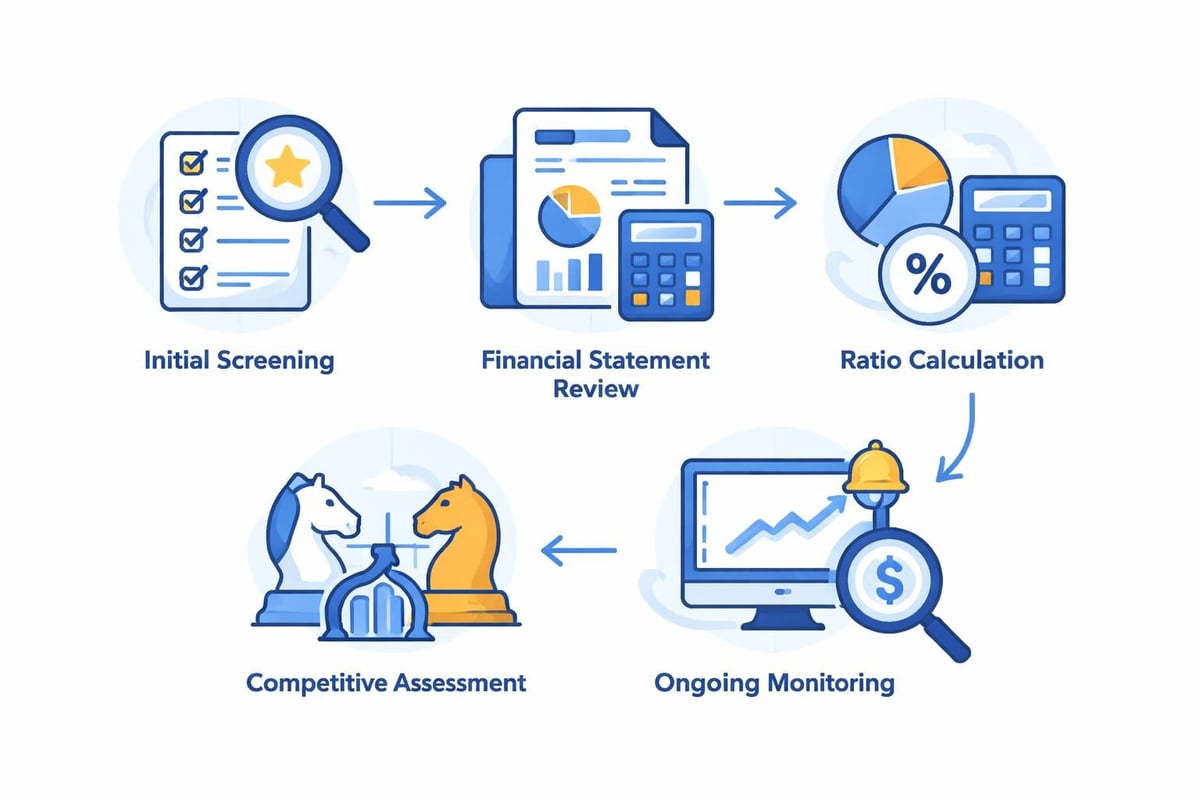
Fundamental Analysis Workflow:
- Screen for companies meeting initial criteria
- Review financial statements for the past 5-10 years
- Calculate key ratios and compare to industry peers
- Assess competitive position and management quality
- Project future performance under various scenarios
- Determine intrinsic value using multiple methods
- Compare intrinsic value to current market price
- Monitor ongoing performance and adjust thesis as needed
Historical context enhances this process significantly. Understanding how companies performed during previous economic cycles provides insights into resilience and adaptability. Comparing current valuations to historical ranges helps identify when securities trade at extremes. Examining management decisions during past challenges reveals leadership quality beyond what recent results show.
Limitations and Complementary Approaches
While fundamental analysis provides a robust framework for investment decisions, recognizing its limitations improves outcomes. Financial statements reflect past performance, not future results. Accounting rules allow significant discretion in revenue recognition, asset valuation, and expense timing. Management can manipulate reported figures within legal boundaries to present favorable pictures.
Qualitative assessments introduce subjectivity that can lead to biases. Analysts may develop emotional attachments to investment theses, dismissing contradictory evidence. Confirmation bias leads investors to seek information supporting existing beliefs while ignoring warning signs. Historical analysis of failed investments often reveals these psychological traps.
Timing presents another challenge. Fundamental analysis might correctly identify an undervalued company, but the market could take years to recognize that value. During that period, investors face opportunity costs and potential drawdowns. As economist John Maynard Keynes famously noted, markets can remain irrational longer than investors can remain solvent.
Some investors combine fundamental analysis with technical analysis to improve timing and risk management. While fundamental analysis identifies what to buy, technical analysis can suggest when to buy based on price patterns, momentum, and support levels. This complementary approach has gained popularity among professional investors who recognize value in both methodologies.
The Evolution of Fundamental Analysis
The practice of fundamental analysis continues evolving as markets, technologies, and business models change. Intangible assets now dominate many company valuations, yet traditional accounting poorly captures their value. Technology companies often show minimal tangible assets on balance sheets while deriving enormous value from software, data, and network effects.
Environmental, social, and governance (ESG) factors increasingly influence fundamental analysis. Historical evidence shows companies with strong governance practices and sustainable business models tend to outperform over long periods. Climate risks, labor practices, and social impact now factor into comprehensive fundamental assessments alongside traditional financial metrics.
The proliferation of alternative data sources offers new inputs for fundamental analysis. Satellite imagery tracking retail parking lots, credit card transaction data, web traffic statistics, and social media sentiment provide real-time business indicators unavailable to previous generations of analysts. Integrating these sources with traditional fundamental analysis creates competitive advantages.
| Traditional Metrics | Modern Additions | Future Considerations |
|---|---|---|
| Revenue, earnings | Customer acquisition costs | AI capability assessment |
| Book value | Network effects valuation | Data asset quantification |
| Dividend yield | ESG scores | Climate transition readiness |
| P/E ratio | Alternative data signals | Cryptocurrency holdings |
Historical perspective remains invaluable as markets evolve. While specific metrics and data sources change, core principles endure. Companies generating consistent cash flows, maintaining competitive advantages, and managing capital efficiently have always created shareholder value. Understanding how these principles applied across different historical contexts strengthens their application to current opportunities.
Mastering fundamental analysis requires combining rigorous financial assessment with historical perspective and continuous learning from both successes and failures. The methodology provides a disciplined framework for separating sustainable businesses from unsustainable trends, a skill that proves valuable across all market conditions. Historic Financial News helps investors develop this perspective by offering interactive tools to explore how fundamental factors influenced market movements throughout history, enabling you to recognize patterns and apply time-tested principles to today's investment decisions.