
Price-to-Earnings Guide: Understanding Valuations in 2025
Are you ready to make smarter investment decisions in 2025? In a world of rapid market shifts, the price-to-earnings ratio remains a cornerstone for understanding how stocks are valued and where real opportunities may lie.
This guide is designed to demystify the price-to-earnings metric, giving you the confidence to interpret valuations and make informed choices in today’s complex investment landscape.
We’ll break down the price-to-earnings formula, walk through real-world examples, compare forward and trailing P/E, explore factors that impact valuations, and share actionable insights tailored for 2025.
Valuation skills have never been more critical. Mastering the price-to-earnings ratio can help you spot undervalued gems, avoid costly mistakes, and navigate volatility with confidence. Let’s dive in and unlock new strategies for your portfolio.
Understanding the Price-to-Earnings Ratio
Unlocking the power of the price-to-earnings ratio starts with a solid grasp of what it means, how it’s calculated, and the nuances between its different forms. Mastering these basics helps investors make sense of valuation signals and avoid common pitfalls.

What is the P/E Ratio?
The price-to-earnings ratio compares a company's share price to its earnings per share (EPS). It tells investors how much they are paying for each dollar of a company’s profits. This ratio is a cornerstone for both absolute and relative valuation methods, helping you decide if a stock is expensive or a potential bargain.
Historically, the price-to-earnings ratio has evolved into one of the most watched metrics in the investment world. For instance, in 2024, the average S&P 500 P/E hovered around 25—a premium compared to long-term averages. This shows that markets sometimes pay up for perceived growth or safety.
Let’s look at a quick example in the table below:
| Company | Share Price | EPS | P/E Ratio |
|---|---|---|---|
| Company A | $30 | $5 | 6 |
| Company B | $30 | $10 | 3 |
A lower price-to-earnings ratio doesn’t always mean a better deal, though. Many investors mistakenly think a low P/E guarantees undervaluation, but it could signal deeper issues or sector-specific norms. For those new to investing, our Key finance terms glossary can help clarify essential concepts mentioned in this guide.
How to Calculate the P/E Ratio
Calculating the price-to-earnings ratio is straightforward but requires attention to detail. Here’s how you do it:
- Find the current share price (use a reliable financial platform or company website).
- Determine the earnings per share (EPS), which is typically calculated as
(Net Income – Dividends on Preferred Stock) / Average Outstanding Shares. - Divide the share price by the EPS.
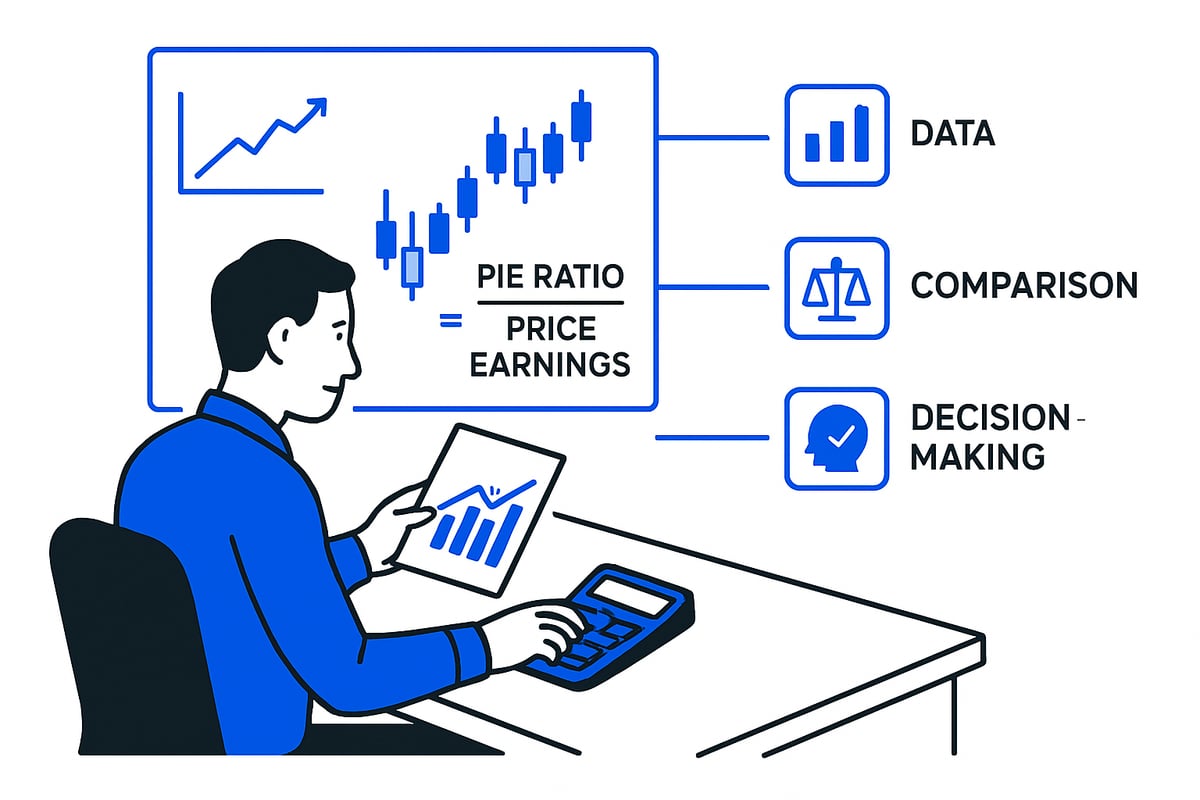
The formula looks like this:
P/E = Market Price per Share / Earnings per Share
For example, imagine a stock trading at $50 in 2025, with an EPS of $2.50. The price-to-earnings ratio would be 20. It’s important to use consistent periods—annual or trailing twelve months (TTM)—for both price and EPS. Also, remember that net income is not the same as total revenue; only profits count toward EPS.
Many S&P 500 companies report both basic and diluted EPS. Always check which figure you’re using, as diluted EPS includes the impact of options and convertible securities. Reliable EPS and share price data are available in audited company filings and major financial data services. Double-checking figures across sources can prevent costly mistakes.
Types of P/E Ratios: Trailing vs. Forward
There are two main types of price-to-earnings ratios: trailing and forward. Trailing P/E uses earnings from the past 12 months (TTM), reflecting what a company has actually achieved. Forward P/E, on the other hand, is based on projected earnings for the next 12 months, relying on analyst forecasts and company guidance.
Each type has its strengths and weaknesses. Trailing P/E is grounded in real results but may not reflect upcoming changes in the business environment. Forward P/E incorporates future expectations but is vulnerable to estimation errors. For example, if Apple’s trailing P/E is 28 and its forward P/E is 24, investors are expecting earnings growth.
Sector averages also tell a story. In 2024, the tech sector’s forward P/E averaged 29, while industrials sat at 18. Investors often compare both types of price-to-earnings ratios to get a fuller picture of value and expectations. Understanding when to use each can sharpen your investment decisions and help you spot shifts in market sentiment.
Why the P/E Ratio Matters in 2025
Understanding the price-to-earnings ratio is more important than ever for investors navigating the dynamic 2025 market. With shifting sector trends, evolving economic conditions, and rapid technological advancements, knowing how to interpret this fundamental metric can help you spot opportunities and steer clear of costly errors. Let’s break down why the price-to-earnings ratio remains at the heart of smart investing.
The P/E Ratio as a Valuation Tool
The price-to-earnings ratio is a powerful lens for comparing companies, regardless of their share prices. It allows investors to see how much the market is willing to pay for each dollar of a company's earnings, making it easier to compare firms across different industries and sizes.
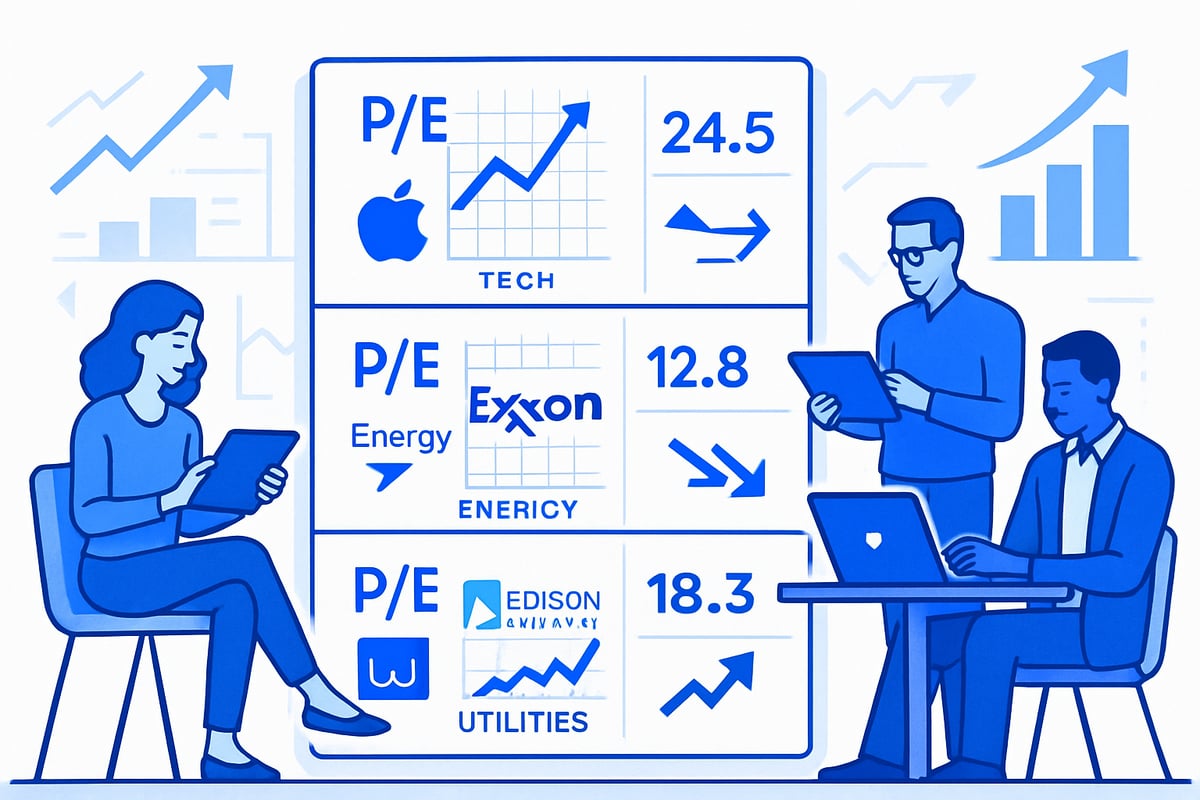
A high price-to-earnings ratio often signals optimism about future growth, while a low one can point to skepticism or undervaluation. For example, a utility stock with a P/E of 15 contrasts sharply with a tech stock trading at a P/E of 35. This difference reflects not only industry norms but also market sentiment and growth prospects.
In 2025, the energy sector’s price-to-earnings ratios rebounded after a tough period, highlighting how sector trends shape valuations. Investors use the price-to-earnings ratio as a screening tool to find value or growth opportunities, but it’s vital to compare companies within the same sector for meaningful insights.
For real-time context, check out the S&P 500 P/E Ratio Trends to see how market-wide valuations are evolving this year.
Interpreting High vs. Low P/E Ratios
Not all price-to-earnings ratios tell the same story. A high price-to-earnings ratio can mean a stock is overvalued or that investors expect rapid growth, as seen in speculative bubbles or hot sectors. Conversely, a low price-to-earnings ratio might indicate a bargain—or signal underlying problems like declining earnings or industry headwinds.
Let’s consider two stocks: one with a price-to-earnings ratio of 50 and another at 10. The former might be in a booming tech sector, fueled by AI breakthroughs and rapid revenue expansion. The latter could be a mature company facing slow growth, or it might be undervalued due to market overreaction. In 2025, the AI sector’s high price-to-earnings ratios are often justified by strong earnings growth, but it’s important to remain cautious.
Data shows that historically, stocks in the lowest 20% of price-to-earnings ratios have outperformed those in the highest 20% by 2-3% annually. However, a low price-to-earnings ratio is not always a green light; it can also be a warning sign of poor business prospects. Always interpret the price-to-earnings ratio in the context of industry norms and macro trends.
When P/E Ratios Can Be Misleading
While the price-to-earnings ratio is a foundational metric, it can sometimes paint a misleading picture. Earnings manipulation—through non-recurring items or accounting changes—can distort the ratio. In cyclical industries, price-to-earnings ratios often spike or plunge as earnings swing with the economic cycle, making the metric less reliable.
If a company reports negative or near-zero earnings, the price-to-earnings ratio becomes meaningless. For example, airlines in 2020-2021 had inflated ratios due to pandemic-related losses. Similarly, a high price-to-earnings ratio doesn’t guarantee future growth, nor does a low one ensure a bargain. Growth traps and value traps are real risks for investors relying solely on this metric.
In 2024, 15% of S&P 500 companies reported negative earnings per share, underscoring the need for supplementary metrics like EV/EBITDA, Price/Sales, or the PEG ratio. To make sound decisions, always combine the price-to-earnings ratio with a broader financial analysis and stay alert to red flags in earnings quality or reporting.
Factors Influencing P/E Ratios in 2025
Understanding what shapes a company’s price-to-earnings in 2025 is essential for making informed investment decisions. From company fundamentals and industry shifts to macroeconomic trends and accounting tactics, several moving parts can impact how the market values stocks.

Company-Specific Drivers
A company’s fundamentals are the first stop when analyzing the price-to-earnings ratio. Rapid earnings growth often leads to higher P/Es, as investors anticipate future profits. Strong profit margins and operational efficiency can also boost valuations.
Debt levels play a big role too. A company with high leverage may see its price-to-earnings ratio fall as investors price in risk. To see how debt impacts valuation, check out this debt-to-equity ratio explained guide. Dividend policies matter as well—firms with consistent payouts may attract income-focused investors, influencing P/E multiples.
Consider a company that reduces debt and boosts earnings per share. Its price-to-earnings ratio can expand, especially if management credibility is high. Data shows that companies growing EPS by 10%+ annually often command P/Es 30% above peers.
Industry and Sector Trends
Sector dynamics can dramatically affect a company’s price-to-earnings. Each industry has its own “normal” P/E range—utilities typically trade lower than tech. In 2025, AI, green energy, and healthcare sectors saw P/E expansion due to innovation and investor demand.
Regulatory changes or disruptive technology can shift these norms quickly. For example, renewable energy’s average price-to-earnings ratio jumped 20% as more investors chased sustainable growth. Here’s a snapshot of S&P 500 sector P/Es in 2025:
| Sector | Avg. P/E |
|---|---|
| Technology | 30 |
| Financials | 14 |
| Consumer Staples | 20 |
Cyclical sectors tend to have more volatile P/E ratios, while defensive sectors remain steadier.
Macroeconomic and Market Forces
Broader market conditions are powerful drivers of the price-to-earnings ratio. Rising interest rates often compress P/E multiples, as higher yields make stocks less attractive compared to bonds. Inflation can also erode valuations, especially if it threatens profit margins.
Economic growth forecasts and recession fears shift investor sentiment, sometimes suddenly. For example, in 2025, Federal Reserve rate hikes led to a 10% drop in average price-to-earnings multiples across the S&P 500. Historically, every 1% rise in 10-year Treasury yields lowers average P/E by about 1.5 points.
Global events—geopolitical tensions, supply chain issues—also ripple through the market, affecting P/E ratios as risk appetite changes.
Accounting and Reporting Factors
How a company reports earnings can skew its price-to-earnings ratio. Differences between GAAP and non-GAAP earnings, or the treatment of non-recurring items, can make the numbers look better (or worse) than reality.
Stock buybacks are another factor. When a firm aggressively repurchases shares, it reduces the share count, boosting EPS and lowering the price-to-earnings ratio artificially. In 2024, S&P 500 buybacks reached $900 billion, impacting reported P/Es.
Always dig into footnotes and disclosures to assess the quality of earnings. Consider both adjusted and reported figures before drawing conclusions about value.
Common Pitfalls and Best Practices
Relying on the price-to-earnings ratio alone can be risky. Temporary earnings boosts or unsustainable profits may create P/E traps. Always compare companies within the same sector to avoid “apples to oranges” mistakes.
Use both trailing and forward price-to-earnings for a balanced view. Supplement your analysis with other metrics, and monitor changes in analyst estimates. Stay educated—market and accounting standards evolve.
Being aware of these practices helps investors avoid costly errors and get the most from price-to-earnings analysis.
Step-by-Step Guide to Using P/E Ratio for Investment Decisions
Ready to turn the price-to-earnings ratio into a practical tool for your 2025 investment strategy? Here’s a step-by-step approach to help you analyze stocks with greater confidence. Each step is designed to make the process simple, actionable, and relevant for today’s fast-moving markets.
Step 1: Gather Reliable Data
Start by ensuring your inputs for the price-to-earnings calculation are accurate and up to date. Reliable data sources include company filings, trusted financial data platforms, and audited annual or quarterly reports. Consistency is key—always use the same reporting period (like annual or trailing twelve months) for both share price and earnings per share.
Watch for any restatements, one-time events, or non-recurring items that could skew results. For example, when using 2025 Q1 earnings reports, check footnotes for adjustments or unusual gains and losses. Cross-reference numbers from multiple sources if possible.
Over 80% of institutional investors rely on audited financials to ensure their price-to-earnings analysis stands on solid ground. Avoid using outdated or adjusted figures unless you clearly understand the reasons behind those changes.
Step 2: Calculate the P/E Ratio
Now, apply the formula:
P/E Ratio = Market Price per Share / Earnings per Share (EPS)
Let’s work through a quick example. Suppose a stock trades at $50 per share and reports an EPS of $2.50 for the past year. Its price-to-earnings ratio is 20.
Use the same method for both trailing and forward calculations, but make sure EPS is positive and not distorted by buybacks or dilutions. If a company reports both basic and diluted EPS, choose the one most relevant for your analysis. Round your results to a reasonable number of decimal places for clarity.
By consistently calculating the price-to-earnings ratio, you set a reliable foundation for comparing stocks and tracking changes over time.
Step 3: Compare Within Industry and Market Context
A price-to-earnings ratio is most useful when you benchmark it against industry averages and market-wide norms. For example, in 2025, S&P 500 utilities had an average P/E of 15, while tech stocks averaged 30. If a retail company trades at P/E 8 compared to a sector average of 16, dig deeper—is it a bargain or a warning sign?
Check for market trends, such as whether all sectors are experiencing higher or lower P/Es. Outliers deserve extra scrutiny. In 2025, the S&P 500 median P/E reached 22, up from 19 in 2023, reflecting broader market optimism.
For more insights, you can review Analysts' Top S&P 500 Stocks to see how current market leaders are valued compared to their peers.
Step 4: Analyze Forward vs. Trailing P/E
Looking at both trailing and forward price-to-earnings ratios provides a fuller picture. Trailing P/E uses the past 12 months’ earnings, reflecting actual performance, while forward P/E is based on analyst forecasts for the next year.
If a company’s forward P/E is lower than its trailing P/E, the market expects earnings growth. A higher forward P/E might signal anticipated earnings declines or over-optimism. For example, an AI company with a trailing P/E of 60 and a forward P/E of 40 suggests investors are betting on rapid growth.
In 2024, growth stocks’ forward P/E was on average 15% lower than their trailing P/E, highlighting market expectations for robust future earnings. Always reassess as new results come in.
Step 5: Assess Qualitative and Quantitative Factors
Numbers tell only part of the story. Evaluate the company’s fundamentals—growth prospects, management strength, competitive position, and industry trends. Consider macroeconomic factors like interest rates, inflation, and geopolitical risks, which can all shape the price-to-earnings landscape.
Review earnings quality: Are profits recurring, or are they boosted by one-off events? A low P/E with high debt or poor cash flow may not be a true bargain. Supplement your analysis with other metrics, such as the quick ratio, to get a fuller sense of financial health.
In 2025, 70% of fund managers said qualitative factors were “very important” when interpreting P/E ratios. Take a holistic view by combining numbers with context.
Step 6: Make Informed Investment Decisions
Bring it all together. Use your price-to-earnings analysis alongside other valuation tools like PEG or EV/EBITDA. Decide whether a stock deserves a buy, hold, or sell based on its P/E relative to sector averages, growth outlook, and risk profile.
For instance, a company with a P/E below its sector average, strong earnings growth, and low debt could be a compelling buy. Monitor shifts in earnings forecasts and market sentiment to adjust your targets as new information emerges.
Remember, the price-to-earnings ratio is one tool—don’t rely on it in isolation. By integrating it with broader analysis, you’ll make sharper, more confident investment decisions in 2025.
Advanced Perspectives and Frequently Asked Questions
Investors who want to level up their understanding of the price-to-earnings ratio often have nuanced questions about its use, limitations, and relevance across different scenarios. Let’s dive into advanced perspectives and address some of the most common FAQs that come up in 2025’s dynamic market landscape.
P/E Ratio vs. Other Valuation Multiples
The price-to-earnings ratio is a go-to metric, but it’s not the only tool in your valuation toolkit. Other multiples like EV/EBITDA, Price/Sales, and Price/Book offer different perspectives, especially when companies have high debt, negative earnings, or unique capital structures.
| Multiple | Best Use Case | Limitation |
|---|---|---|
| Price-to-Earnings | Profitable, stable companies | Skewed by accounting choices |
| EV/EBITDA | Capital-intensive industries | Ignores tax and capex effects |
| Price/Sales | Early-stage, low-profit companies | Doesn’t account for margins |
For example, a capital-intensive utility may have a low price-to-earnings ratio, but its EV/EBITDA reveals a truer picture once debt is considered. In 2025, 40% of S&P 500 analysts use several multiples, not just price-to-earnings, to reach a robust conclusion. It’s smart to blend these tools for deeper insight.
The Impact of Market Cycles on P/E Ratios
Market cycles have a direct impact on the price-to-earnings ratio. During expansions, optimism often pushes P/E ratios above historical norms. In recessions, uncertainty compresses valuations. For instance, average P/E dropped to 18 during the 2020 pandemic but rebounded to 25 by 2024 as recovery set in.
Investor psychology—fear and greed—drives these swings. Sector rotation can also cause abrupt changes, with tech and growth stocks often leading on the way up. When Barclays lifted its S&P 500 target for 2025, it reflected renewed confidence in earnings growth and resilience (Barclays Raises S&P 500 Target). Always compare a company’s price-to-earnings ratio to historical and sector averages, not just current market euphoria or gloom.
Common P/E Ratio Myths and Misconceptions
There are several myths about the price-to-earnings ratio. One common misconception is that a low price-to-earnings always signals a bargain. In reality, it might point to declining prospects or sector-specific challenges. Some investors also believe P/E is automatically forward-looking, but unless specified, it’s usually based on trailing earnings.
For example, value traps abound in sectors facing long-term decline, even if their P/E looks cheap. In 2025, 30% of retail investors misinterpret low price-to-earnings as a buy signal, ignoring other vital factors like debt or earnings quality. A comprehensive approach—considering growth, industry, and qualitative factors—is essential to avoid pitfalls.
P/E Ratio in Global Markets
The price-to-earnings ratio isn’t a one-size-fits-all metric globally. In 2025, US tech companies averaged a P/E of 30, while their European peers sat at 22 and Chinese tech at 28. Local economic conditions, regulation, and reporting standards all influence these differences.
Currency fluctuations and local accounting rules can also skew comparisons. The global average price-to-earnings was 20 in 2025, but regional dispersion remains wide. Investors should adjust for these differences and avoid “home bias” when comparing companies across borders. Always benchmark global valuations with context in mind.
Real-World Case Studies: 2025 Market Examples
Case studies bring the price-to-earnings ratio to life. In 2025, the tech sector’s high P/E was justified by AI-driven earnings growth. Oracle’s stock, for example, surged as investors bet on AI’s transformative potential (Oracle's AI-Driven Stock Surge).
Meanwhile, energy stocks rebounded as oil prices stabilized, pushing their P/E ratios higher. Defensive consumer staples maintained steady price-to-earnings multiples despite inflation. In fact, the top 10 S&P 500 gainers in 2025 had an average P/E of 35. These shifts underscore how market events and innovation can rapidly reshape valuation landscapes.
Now that you’ve got a solid grip on P/E ratios and how they shape investment decisions in 2025, imagine what you could learn by exploring the bigger historical picture behind market valuations. With Historic Financial News, you don’t just see the numbers—you uncover the stories, trends, and lessons that can make you a sharper, more confident investor. If you’re curious about how market history repeats itself and want to be among the first to experience our interactive platform, Join Our Beta. Let’s look back together so you can move forward smarter.