
Interest Coverage Ratio Guide: Understand & Analyze in 2025
Is your business prepared to weather rising interest rates and economic uncertainty in 2025? Navigating financial storms requires more than luck—it demands a clear understanding of key metrics that signal your company’s stability.
This guide breaks down the interest coverage ratio, showing you how to analyze, interpret, and use this vital tool for smarter decision-making. You’ll discover its definition, calculation steps, practical interpretation tips, industry benchmarks, and actionable strategies to keep your business resilient.
Ready to take control of your financial future? Let’s master the interest coverage ratio together and ensure your business can thrive, no matter what 2025 brings.
What is the Interest Coverage Ratio?
Understanding the interest coverage ratio is crucial for any business leader or investor who wants to confidently assess a company's ability to handle its debt. This ratio serves as a financial health check, helping you see at a glance whether an organization can comfortably meet its interest payments.
Definition and Core Concepts
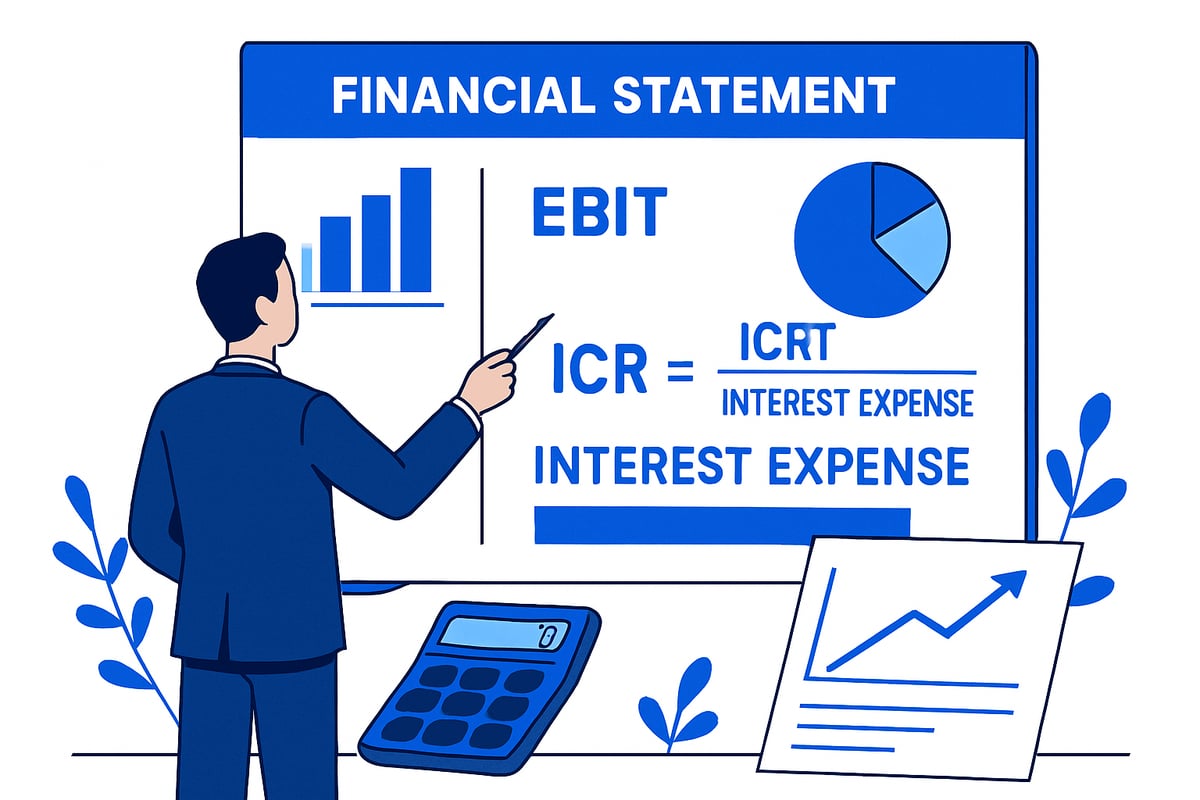
The interest coverage ratio (ICR) tells you how well a company can pay interest on its outstanding debt using its operating earnings. Specifically, it is calculated as:
Interest Coverage Ratio = EBIT / Interest Expense
Here, EBIT stands for Earnings Before Interest and Taxes. The main goal of the interest coverage ratio is to measure how many times a company's operating income covers its interest obligations during a set period.
Lenders and investors focus closely on this ratio because it signals risk. A higher interest coverage ratio means the company is more capable of meeting its debt costs, making it a safer bet for loans or investments. By contrast, a low interest coverage ratio could be a red flag for potential financial stress.
Let's see a simple example. Imagine Company A reports an EBIT of $300,000 and annual interest expenses of $100,000. Their interest coverage ratio would be:
| Metric | Amount |
|---|---|
| EBIT | $300,000 |
| Interest Expense | $100,000 |
| ICR | 3.0 |
So, Company A can cover its interest payments three times over with its operating income.
It's important not to confuse the interest coverage ratio with the minimum interest coverage ratio. The former is the actual calculated value, while the latter is a threshold often set in loan agreements, specifying the lowest acceptable ratio a company must maintain.
For readers who want to brush up on related finance terms like EBIT and interest expense, our Core Finance Terms Explained resource can be a helpful reference.
Key Components: EBIT and Interest Expense
To use the interest coverage ratio effectively, you need to understand its core components: EBIT and interest expense.
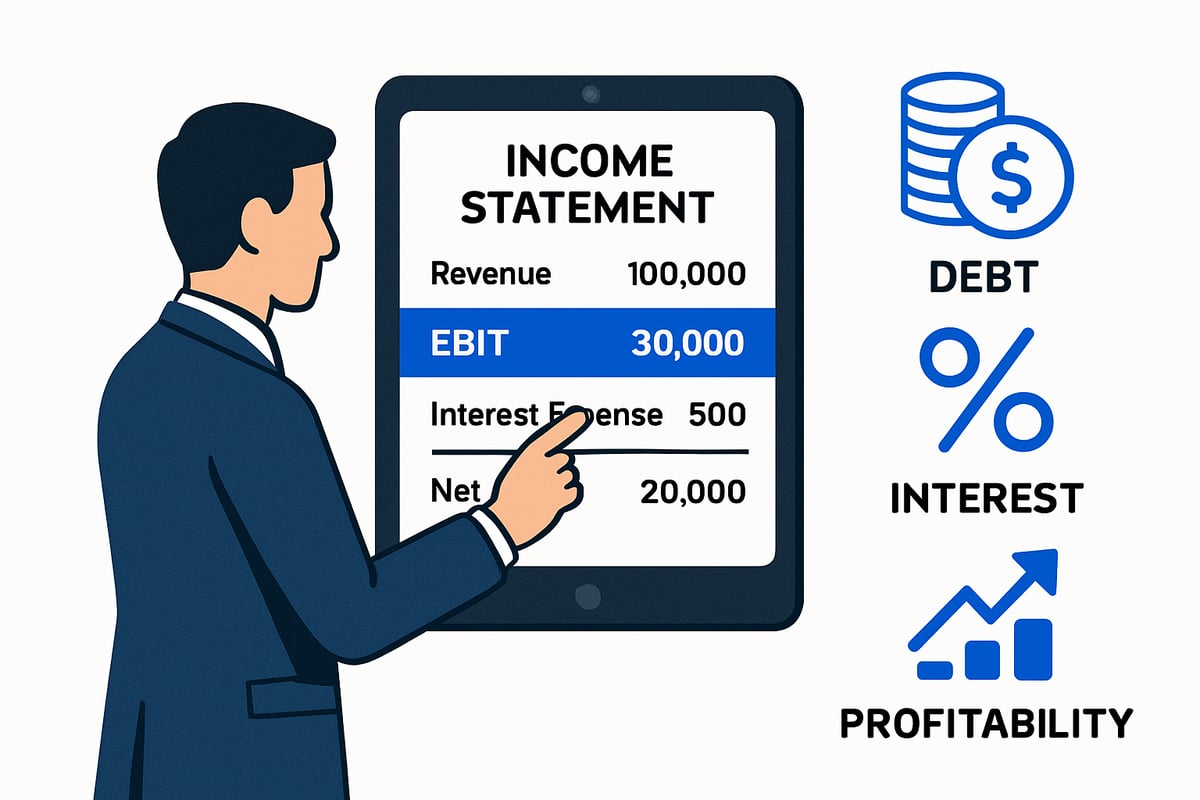
EBIT (Earnings Before Interest and Taxes) reflects a company’s true operating profitability, before accounting for financing and tax costs. You’ll find EBIT on the income statement, often listed explicitly or calculated by taking operating income and adding back any non-operating income and expenses.
Interest expense is the total cost a company pays to service its debt over a period. This figure is clearly shown in the income statement, typically under "interest expense" or "finance costs." It’s important to exclude nonrecurring or extraordinary items—such as one-time gains or losses—when determining EBIT and interest expense, since these can distort the interest coverage ratio.
Let’s look at a quick example using a sample income statement:
| Income Statement Item | Amount |
|---|---|
| Revenue | $1,000,000 |
| Operating Expenses | $600,000 |
| EBIT | $400,000 |
| Interest Expense | $160,000 |
ICR = $400,000 / $160,000 = 2.5
Accounting methods can also influence the interest coverage ratio. For instance, aggressive capitalization of expenses or recognition of nonrecurring income can inflate EBIT, making the ratio appear stronger than it truly is. Always check the notes in annual reports to understand how these figures are derived.
Mastering where to find these numbers and how to interpret them is essential for using the interest coverage ratio as a reliable financial tool.
Why the Interest Coverage Ratio Matters in 2025
The interest coverage ratio has never been more important for businesses than it is heading into 2025. As markets brace for rising rates and economic turbulence, understanding this metric can mean the difference between thriving and struggling to survive.
Assessing Financial Health and Risk
The interest coverage ratio is a central measure of a company’s financial stability. It tells you how comfortably a business can pay the interest on its debts using its operating profits. A strong interest coverage ratio reassures lenders and investors that the company is not overextended.
Lenders often use the interest coverage ratio as a key part of their risk assessment process. They want proof that a business can consistently meet its debt obligations, especially when cash flows fluctuate. Investors also monitor this ratio, as it signals whether a company’s earnings are robust enough to handle both current and future debt payments.
A commonly cited benchmark is that an interest coverage ratio below 1.5 may signal financial distress. At this level, earnings barely cover interest payments, leaving little room for error. Conversely, a ratio above 5 indicates a company is in a strong position, with earnings comfortably covering interest expenses. The table below summarizes these implications:
| Interest Coverage Ratio | Financial Health | Risk Level |
|---|---|---|
| Below 1.5 | Distressed | Very High |
| 1.5 – 2.0 | Vulnerable | Elevated |
| 2.0 – 5.0 | Stable | Moderate |
| Above 5.0 | Strong | Low |
Consider Company X, whose interest coverage ratio fell from 3.0 to 1.2 during a recent downturn. This drop alarmed lenders, who responded by tightening loan terms and raising borrowing costs. Investors, too, became wary, leading to a dip in the company’s market value.
The interest coverage ratio not only affects borrowing terms but also impacts a company’s access to new capital. Firms with low ratios may face higher interest rates or outright loan rejections. In contrast, a healthy ratio can lower financing costs and provide more growth opportunities.
Regularly monitoring the interest coverage ratio helps leaders spot early warning signs and take corrective action before problems escalate. It’s not just a backward-looking metric—it’s a forward-looking tool for financial resilience.
ICR in the 2025 Economic Landscape
Looking ahead to 2025, the interest coverage ratio will be under even closer scrutiny. With central banks signaling higher rates and inflation persisting, companies may see their interest expenses climb sharply. This environment makes it critical to track the interest coverage ratio closely.
A company with significant floating rate debt, for instance, could see its interest coverage ratio deteriorate quickly if rates rise by just 1%. Here’s a simplified example:
EBIT: $400,000
Old Interest Expense (5%): $100,000
ICR: 4.0

New Interest Expense (6%): $120,000
ICR: 3.33
Even a modest rate hike can push a borderline company closer to distress. That’s why many lenders are revisiting their loan covenants, often raising minimum required interest coverage ratio thresholds for new loans.
Regulators are also tightening standards. As noted in the IMF Working Paper on Interest Rates and Financial Stability, prolonged high rates can stress even established firms, making robust financial metrics like the interest coverage ratio essential for assessing resilience.
Investor sentiment is closely tied to the interest coverage ratio as well. A sudden decline in this metric can trigger a sell-off, while stable or improving ratios often boost market confidence and valuation.
In summary, the interest coverage ratio is not just a number on a balance sheet. In 2025, it’s a vital signal of a business’s ability to weather financial storms, adapt to changing markets, and maintain trust with lenders and investors. Monitoring and managing this ratio will be key for survival and growth in the coming year.
How to Calculate and Analyze the Interest Coverage Ratio
Understanding how to calculate and analyze the interest coverage ratio is vital for anyone managing business finances in 2025. This step-by-step guide will walk you through the process, helping you make sense of the numbers and use them to support sound financial decisions.
Step 1: Gather Financial Data
Start by collecting the two main ingredients for the interest coverage ratio: EBIT (Earnings Before Interest and Taxes) and interest expense. EBIT is typically found near the top of your income statement, representing your company’s operating profits before deducting interest and taxes. Interest expense is often listed below EBIT and reflects the total cost of servicing your company’s debt.
Be careful to exclude non-operating or one-time items from EBIT, as these can distort the interest coverage ratio. Similarly, make sure your interest expense figure includes only costs related to debt, not other financial charges. For companies with loans tied to variable rates, the interest expense may fluctuate, so it’s smart to review notes on floating rate loan impact for an accurate picture.
Look for these numbers in your annual report or financial statements. Double-check for adjustments or footnotes that might affect either figure.
Step 2: Apply the ICR Formula
Once you have your data, plug the numbers into the interest coverage ratio formula:
Interest Coverage Ratio (ICR) = EBIT / Interest Expense
Suppose Company Y reports EBIT of $500,000 and interest expense of $200,000. The calculation would look like this:
ICR = $500,000 / $200,000 = 2.5
Rounding conventions can slightly affect the result, so always specify your method. Some companies round to one decimal place, while others use two. Also, check if your accounting period matches for both figures to avoid skewed results. Calculating the interest coverage ratio accurately ensures you have a reliable metric for analysis.
Step 3: Interpret the Results
Now, let’s interpret what your interest coverage ratio reveals. An ICR below 1.5 is generally a red flag, signaling the business may struggle to meet debt payments. Ratios above 2.0 are typically considered healthy, while anything over 5.0 is strong and suggests low default risk.
Trends matter, too. If your interest coverage ratio is declining year over year, it could be a warning sign of mounting debt or shrinking profits. For example, if Company Z’s ICR drops from 3.2 to 2.0 over three years, this trend may concern lenders and investors. Avoid relying solely on a single year’s ratio—look for patterns over time.
Step 4: Compare Against Industry Benchmarks
Comparing your company’s interest coverage ratio to industry benchmarks is essential for meaningful analysis. Different sectors have varying norms. For instance, capital-intensive industries like manufacturing often report lower ICRs due to higher debt loads, while service-based companies may maintain higher ratios.
Here’s a quick comparison:
| Industry | Typical ICR Range |
|---|---|
| Manufacturing | 2.0–4.0 |
| Technology | 4.0–8.0 |
| Utilities | 2.5–5.0 |
| Services | 5.0+ |
Consult analyst reports or online databases for up-to-date benchmarks. This context helps you gauge whether your interest coverage ratio is competitive or lagging.
Step 5: Monitor and React to Changes
Regularly monitoring your interest coverage ratio is a smart habit, especially in uncertain economic climates. Watch for triggers like a breach of minimum loan covenants or a sharp drop in EBIT. If you notice your ratio slipping, consider actions such as renegotiating debt terms, boosting earnings, or cutting costs.
For example, a company facing a potential default improved its interest coverage ratio by selling non-core assets and increasing operational efficiency. Consistent review and proactive management can help you avoid surprises and maintain financial health.
Setting, Meeting, and Managing Minimum Interest Coverage Ratios
Is your business aware of how vital the interest coverage ratio is to financial stability? Understanding and managing minimum requirements is essential for staying in good standing with lenders and investors. Let’s break down what you need to know for 2025.
Minimum ICR Requirements in Lending
Lenders often set a minimum interest coverage ratio in loan covenants to protect themselves against default risk. This minimum interest coverage ratio acts as a safety net, ensuring your company can reliably meet interest payments. For example, a loan agreement might specify a minimum interest coverage ratio of 2.0. If your business falls below this threshold, you could face penalties, higher interest rates, or even a technical default.
Why do lenders care so much? The interest coverage ratio provides a quick snapshot of your ability to service debt using operating income. If your ratio slips, it signals rising risk, prompting lenders to act swiftly. Some industries, like utilities, may have lower minimums, while tech startups might be required to maintain higher ratios due to revenue volatility.
Understanding your minimum interest coverage ratio obligations is crucial. Regularly check your loan agreements for these covenants and plan ahead to avoid surprises.
Strategies to Maintain a Healthy ICR
Maintaining a strong interest coverage ratio is not just about compliance, it’s about financial resilience. To boost your ratio, focus on increasing EBIT by growing revenue or cutting unnecessary costs. For example, streamlining operations or renegotiating supplier contracts can make a meaningful impact. On the other side, reducing interest expense—through refinancing at lower rates or paying down debt—can also improve your standing.
Consider a company that sells non-core assets to quickly raise cash and reduce debt. This move can instantly enhance the interest coverage ratio, helping the business stay above covenant minimums. Scenario analysis and financial forecasting are vital tools to anticipate future pressure points. Regularly modeling “what-if” scenarios ensures you are prepared for economic shifts.
Proactive management of the interest coverage ratio supports both short-term goals and long-term strategic decisions.
Industry and Economic Considerations
Minimum interest coverage ratio requirements are not one-size-fits-all. Capital-intensive industries, such as manufacturing or utilities, may operate with lower ratios due to stable cash flows. In contrast, service or tech sectors often need higher ratios to reassure lenders about their ability to weather fluctuations.
Economic downturns and rising interest rates can quickly erode your interest coverage ratio. Companies with minimal headroom may face difficulties meeting obligations during tough times. For example, during a recession, a utility company’s predictable revenue might protect its ratio, while a tech startup with variable income could see its ratio fall dangerously low.
Understanding your industry’s benchmarks and economic risks gives you an edge. Always compare your interest coverage ratio to appropriate peers and adjust strategies accordingly.
Limitations and Common Pitfalls
Relying solely on the interest coverage ratio can be risky. This metric focuses on short-term profitability and may ignore non-operational income or cash flow issues. Sometimes, companies with a strong interest coverage ratio still struggle if their cash flow is weak or if earnings are inflated by one-time events.
There is also a risk of manipulation, such as excluding certain expenses to present a healthier ratio. To get a full picture, always use the interest coverage ratio alongside other financial metrics. For example, the debt-to-equity ratio helps assess long-term solvency and complements your understanding of risk.
Use the interest coverage ratio as part of a broader toolkit, not as the only measure of financial health.
Advanced Insights: Using ICR for Deeper Financial Analysis
The interest coverage ratio, when used beyond its basic calculation, becomes a powerful lens for understanding a company’s evolving financial health. By layering trend analysis, strategic decision-making, investor relations, and regulatory context, you can transform this ratio from a static figure into a dynamic forecasting tool.
Trend Analysis and Predictive Insights
Tracking the interest coverage ratio over multiple periods reveals much more than a single year’s snapshot. By plotting this ratio quarterly or annually, you can detect emerging patterns, such as steady improvement or worrisome declines. A downward trend in the interest coverage ratio may serve as an early warning sign of looming liquidity challenges, even if current values appear acceptable.
Integrating the interest coverage ratio with other financial metrics, like the quick ratio, allows for more nuanced analysis. For example, a company may maintain a stable interest coverage ratio but see its quick ratio deteriorate, suggesting growing short-term liquidity pressure. For a deeper dive into how these metrics complement each other, see Quick Ratio vs. ICR.
To illustrate, imagine a manufacturer whose interest coverage ratio drops from 4.0 to 2.2 over three years. On its own, this decline indicates rising risk, prompting management to investigate root causes. By examining related ratios and cash flow data, stakeholders can forecast whether the company may struggle to meet debt obligations in the future.
ICR in Strategic Decision-Making
The interest coverage ratio is a vital compass when considering major corporate moves. In mergers and acquisitions, acquirers scrutinize the target’s ratio to assess its ability to absorb new debt. A low interest coverage ratio may signal that expansion plans should be postponed until earnings stabilize or debt is reduced.
Dividend policy is another area where the interest coverage ratio plays a key role. Boards often hesitate to increase payouts if the ratio drops near minimum covenants, prioritizing debt service over shareholder rewards. Similarly, capital allocation decisions—such as investing in new projects or repurchasing shares—are weighed against the company’s ability to comfortably cover interest costs.
For example, a retail company with an interest coverage ratio near 2.0 might defer opening new stores until profitability improves. Management teams use scenario planning to model how different strategies impact the ratio, helping ensure the business remains resilient under various economic scenarios. The interest coverage ratio thus guides both defensive and growth-oriented decisions.
ICR and Investor Relations
Investors closely watch the interest coverage ratio as a barometer of financial safety. A sudden drop in the ratio can spark concern, leading to negative share price reactions and increased scrutiny from analysts. During earnings calls and presentations, executives often address changes in the interest coverage ratio to reassure stakeholders about the company’s debt-servicing capacity.
Transparency around the interest coverage ratio bolsters investor confidence, especially in uncertain markets. For instance, if a technology firm’s interest coverage ratio falls from 5.0 to 3.0, management may proactively explain the drivers—such as a temporary dip in earnings or a strategic investment—while outlining plans to restore the ratio. Clear communication helps mitigate negative sentiment and supports long-term valuation.
Beyond numbers, the interest coverage ratio forms part of a broader narrative about prudent financial management. Companies that consistently maintain strong ratios are more likely to attract institutional investors seeking stability.
Regulatory and Market Developments in 2025
As the financial landscape evolves, the interest coverage ratio is gaining new prominence among regulators and lenders. Rising interest rates, inflation, and shifting lending standards are prompting banks to revisit minimum requirements for this metric. According to the Financial Stability Review, May 2025, many banks anticipate declines in net interest income, making robust coverage ratios even more critical.
Post-pandemic, industries with historically low interest coverage ratios may face tighter scrutiny. Regulators are likely to set higher minimums to guard against systemic risk, especially in sectors with high leverage. Companies that proactively monitor and manage their interest coverage ratio will be better positioned to navigate evolving compliance standards and maintain access to capital.
New guidelines may also influence how the interest coverage ratio is calculated or disclosed, adding a layer of complexity to financial reporting. Staying informed about these changes is essential for executives and finance teams.
Case Studies and Real-World Examples
Real-world scenarios highlight the consequences of ignoring or leveraging the interest coverage ratio. Consider a mid-sized manufacturer that breached its loan covenant after a sharp decline in earnings. The interest coverage ratio fell below the required minimum, triggering penalties and forcing an urgent restructuring. By contrast, another company in the same sector anticipated potential trouble, boosting EBIT through cost-saving measures and asset sales to keep its ratio above critical thresholds.
These cases underscore the importance of regular monitoring and proactive management. Public filings and news reports often provide valuable lessons, illustrating how the interest coverage ratio can signal both risk and opportunity. Utilizing anonymized data, you can simulate various scenarios to stress-test your own business and develop contingency plans.
The interest coverage ratio is more than a compliance metric; it is a strategic tool that, when understood and applied deeply, can chart a company’s path through uncertainty and growth.
Frequently Asked Questions about Interest Coverage Ratio
Understanding the interest coverage ratio is crucial for managing financial health in 2025. Below, we answer the most common questions to help you master this important metric.
What is a “good” interest coverage ratio in 2025?
A good interest coverage ratio typically falls above 2.0, which indicates a business is comfortably meeting its debt obligations. However, in uncertain economic times, lenders and analysts may look for ratios above 3.0 for added safety. Industries with steady cash flows might accept lower ratios, while volatile sectors demand higher ones.
How often should businesses calculate and review their interest coverage ratio?
Businesses should calculate the interest coverage ratio at least quarterly, aligning with financial reporting cycles. In fast-changing markets or during periods of economic stress, monthly reviews can help spot issues early and support proactive management.
Can a company have a negative interest coverage ratio?
Yes, a negative interest coverage ratio occurs when EBIT is negative, meaning a company is losing money before paying interest. This is a red flag for lenders and investors, signaling potential insolvency or urgent need for turnaround measures.
How does the interest coverage ratio differ from other solvency ratios?
The interest coverage ratio focuses specifically on a company’s ability to pay interest expenses from operating earnings. Other solvency ratios, such as the debt-to-equity ratio, assess overall leverage or long-term debt obligations, providing a broader view of financial stability.
What happens if a company fails to meet its minimum interest coverage ratio covenant?
Failure to maintain a minimum interest coverage ratio, often set in loan agreements, can trigger penalties, higher interest rates, or even loan defaults. For example, a lender might require a minimum ratio of 2.0, and breaching this threshold could result in stricter terms or demands for immediate repayment.
Are there differences in interest coverage ratio calculation for public vs. private companies?
The calculation method for interest coverage ratio is generally the same for both public and private companies. However, public companies usually have more detailed disclosures, making it easier to locate EBIT and interest expense figures in their financial statements.
How do rising interest rates affect interest coverage ratio calculations?
Rising interest rates increase interest expenses, which can lower the interest coverage ratio and put pressure on highly leveraged businesses. Regulatory bodies, such as those highlighted in the Federal Reserve's 2025 Stress Test Results, use this metric to assess risk under adverse scenarios.
Where can I find reliable industry benchmarks for interest coverage ratio?
Industry benchmarks are available through analyst reports, financial databases, and public filings. For a practical example, review the United States Steel Corporation Interest Coverage Analysis to see how benchmarks are applied in real-world scenarios.
Staying informed about the interest coverage ratio helps businesses and investors make sound financial decisions in a changing economic environment.
If you’re eager to put your new understanding of the Interest Coverage Ratio into practice and want even deeper financial insights, you’re not alone. At Historic Financial News, we believe that looking at market stories through a historical lens can help you spot patterns and make smarter decisions, especially with economic uncertainty on the horizon. If you’re curious to see how our interactive charts and AI-powered summaries can help you analyze ratios like ICR over time, why not Join Our Beta? You’ll get early access and a chance to help shape a platform designed for curious minds like yours.