
Debt-to-Equity Ratio Guide: Master Financial Analysis 2025
Mastering financial analysis is more vital than ever for business success in 2025. One essential metric stands out: the debt-to-equity ratio. This single figure can unlock insights into a company’s financial stability, growth prospects, and risk profile.
Understanding and applying the debt-to-equity ratio helps investors, analysts, and business leaders make smarter decisions. It is the key to evaluating a company’s capital structure and assessing its ability to weather changing market conditions.
In this comprehensive guide, you’ll discover step-by-step instructions, clear formulas, real-world examples, and expert tips for interpreting the debt-to-equity ratio. By the end, you’ll be ready to confidently analyze, calculate, and leverage this powerful ratio for better financial decision-making.
Get ready to explore the fundamentals, calculation steps, industry benchmarks, and advanced strategies that will set you apart in 2025.
Understanding the Debt-to-Equity Ratio: Foundations and Importance
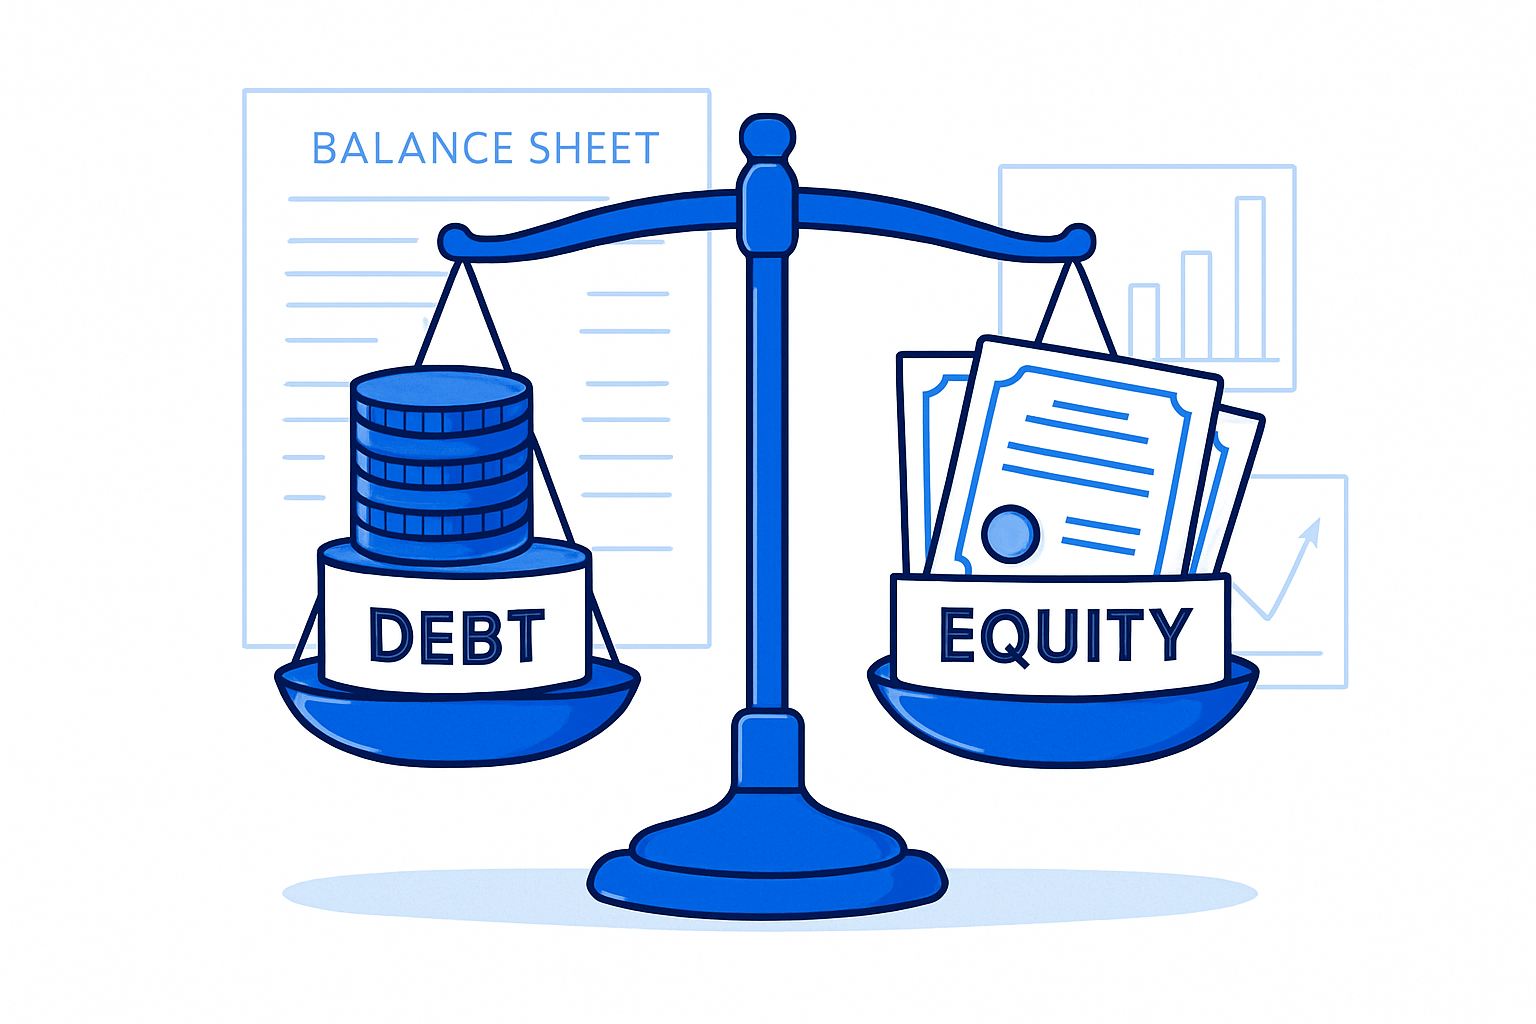
Mastering the debt-to-equity ratio is essential for anyone aiming to analyze a company’s financial health in depth. This metric sits at the core of financial analysis, offering a snapshot of how a business finances its operations—through debt, equity, or a mix of both. Let’s dive into what the debt-to-equity ratio really means, why it matters, and how it shapes decision-making for businesses and stakeholders alike.
What is the Debt-to-Equity Ratio?
The debt-to-equity ratio compares a company’s total liabilities to its shareholders’ equity. In simple terms, it tells you how much debt a business uses to finance its assets relative to the value invested by its owners. This ratio is a cornerstone for financial analysis, helping you gauge the balance between borrowed funds and owner contributions.
Key terms to understand:
- Debt: All money the company owes, including both short-term and long-term liabilities.
- Equity: The residual value for shareholders after debts are paid, including common stock, preferred stock, and retained earnings.
- Liabilities: Financial obligations such as loans, accounts payable, or bonds.
- Shareholders’ equity: The owners’ claim on assets after all liabilities are settled.
Not sure about these terms? The Key financial terms glossary is a helpful resource if you want to brush up on definitions.
The debt-to-equity ratio has evolved over time. Initially, it was a simple check for lenders, but now it’s a dynamic tool for investors, analysts, and executives. Stakeholders use the debt-to-equity ratio to assess risk, determine how much leverage a company is taking on, and evaluate the capital structure.
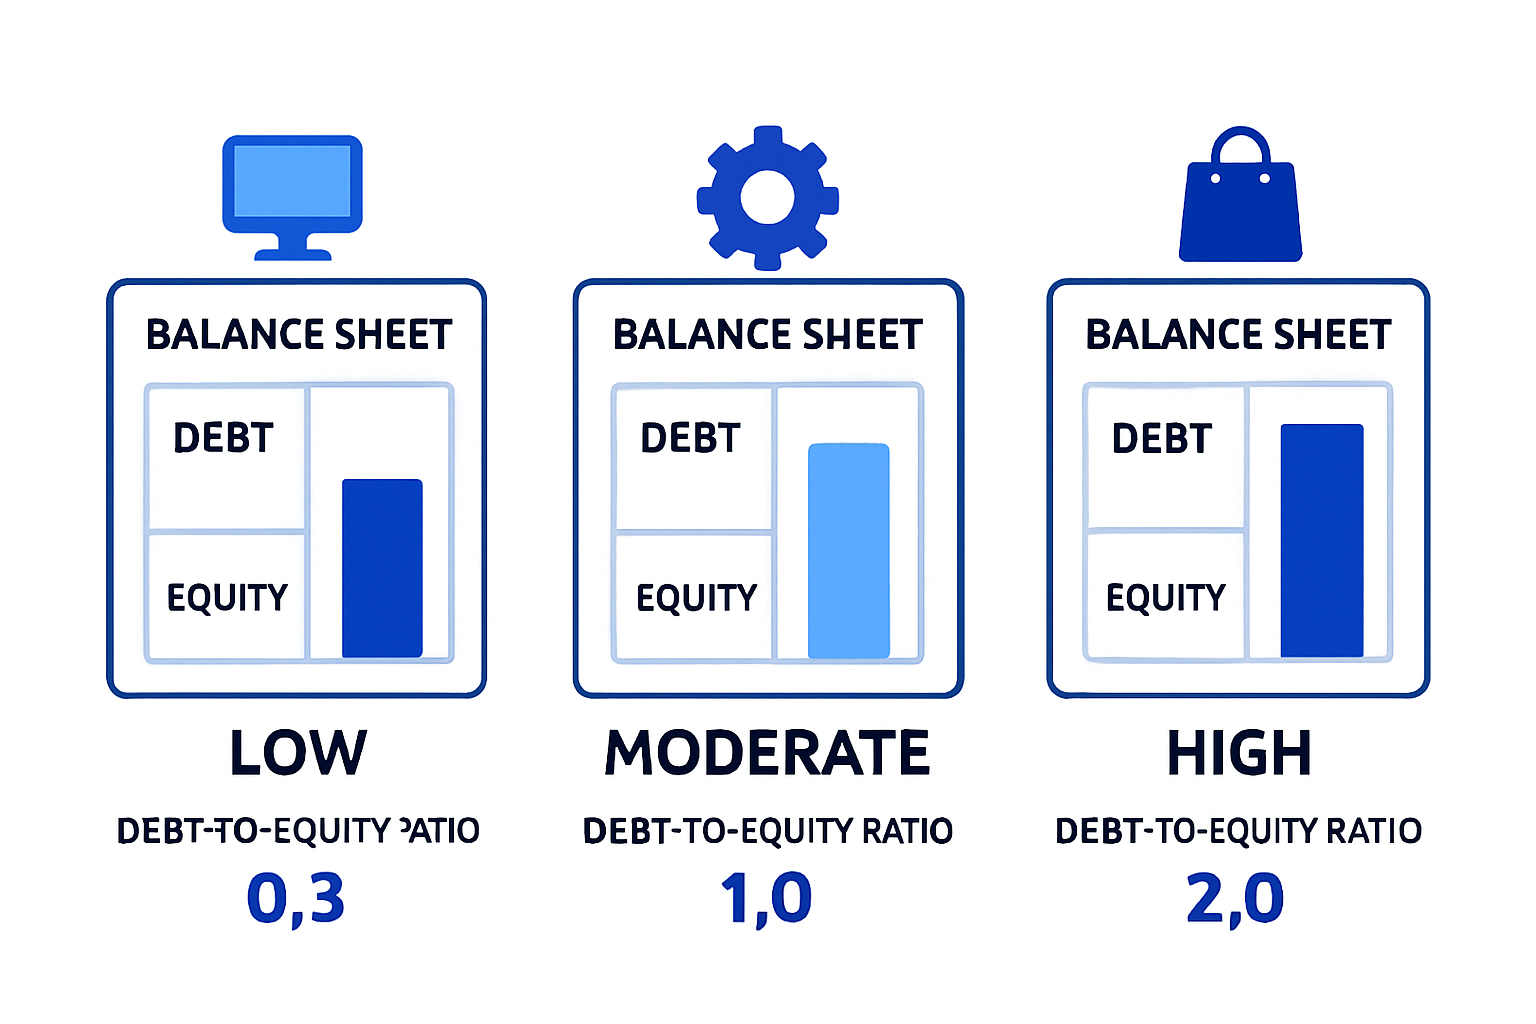
Different ratios tell different stories. For example, a company with a debt-to-equity ratio of 0.3 is considered conservatively financed, relying more on equity. In contrast, a ratio of 9 signals heavy reliance on debt—a riskier posture that may indicate aggressive growth or financial stress. Most companies fall somewhere in between, with a “healthy” debt-to-equity ratio often ranging from 2 to 2.5. However, there’s no universal standard: context, industry, and strategy all play crucial roles.
| Company | Total Liabilities | Shareholders’ Equity | Debt-to-Equity Ratio | Implication |
|---|---|---|---|---|
| A | $250,000 | $750,000 | 0.3 | Conservative, stable growth |
| B | $900,000 | $100,000 | 9.0 | Aggressive, higher risk |
Understanding the debt-to-equity ratio is about more than just numbers. It’s about context—what’s right for one company or industry may be risky for another.
Why the Debt-to-Equity Ratio Matters in 2025
The debt-to-equity ratio is more relevant than ever in 2025 due to ongoing economic uncertainty and rapid market shifts. High inflation, fluctuating interest rates, and unpredictable global events have pushed businesses to rethink their capital structures. The debt-to-equity ratio now plays a pivotal role in showing how resilient a company might be in turbulent times.
Regulators and investors are paying closer attention to how companies balance debt and equity. New rules and reporting standards are influencing how businesses structure their finances. For companies seeking loans or raising capital, the debt-to-equity ratio can determine access to funding and investor confidence.
But it’s not just about standing alone. The debt-to-equity ratio is often used alongside other financial ratios to provide a holistic view of a company’s financial health. Trends since the pandemic show increased scrutiny of leverage, especially in high-interest environments. Companies with a well-managed debt-to-equity ratio are often better positioned to seize growth opportunities or weather downturns.
In summary, while the debt-to-equity ratio has always been a key metric, its importance is only increasing. Understanding its foundations will help you interpret financial statements more confidently and make smarter decisions in 2025.
Step-by-Step Guide: How to Calculate the Debt-to-Equity Ratio
Accurately calculating the debt-to-equity ratio is a foundational skill for anyone looking to understand a company’s financial health. This metric isn’t just a number—it’s a lens into leverage, risk, and capital structure. Whether you’re analyzing a startup or a Fortune 500 firm, mastering this calculation helps you assess stability and growth potential.

The Debt-to-Equity Ratio Formula
The debt-to-equity ratio measures how much a company relies on borrowed funds compared to its own capital. Here’s the standard formula:
Debt-to-Equity Ratio = Total Liabilities / Shareholders’ Equity
Total Liabilities encompass all debts and obligations the business owes, including both current liabilities (like accounts payable, short-term loans) and long-term liabilities (such as bonds or mortgages).
Shareholders’ Equity is what’s left for owners after subtracting all liabilities from assets. This typically includes common stock, preferred stock, and retained earnings.
Let’s see how the debt-to-equity ratio works in practice with two examples:
| Company | Total Liabilities | Shareholders’ Equity | Debt-to-Equity Ratio |
|---|---|---|---|
| A | $250,000 | $750,000 | 0.3 |
| B | $900,000 | $100,000 | 9.0 |
Calculation Steps:
- Locate “Total Liabilities” and “Shareholders’ Equity” on the most recent balance sheet.
- Plug the numbers into the formula.
- For Company A: $250,000 / $750,000 = 0.3
- For Company B: $900,000 / $100,000 = 9.0
The debt-to-equity ratio tells you whether a business is conservatively financed (low ratio) or heavily leveraged (high ratio).
Different business structures may report equity and liabilities differently. Public companies list detailed equity components, while private firms might aggregate figures. Always use the freshest data for accuracy.
Common mistakes to avoid:
- Missing certain liabilities, like leases or deferred taxes.
- Using outdated financial statements.
- Confusing total assets with shareholders’ equity.
- Ignoring off-balance-sheet obligations.
Pro tips for calculation:
- Use a reliable online calculator or spreadsheet template for speed and consistency.
- Double-check that all liabilities, both short and long term, are included.
- Review equity components—don’t overlook retained earnings or treasury stock.
- Compare figures over multiple periods to spot trends.
For a comprehensive breakdown of the debt-to-equity ratio formula, its interpretation, and how to apply it, check out this Debt-to-Equity Ratio Formula and Interpretation resource.
Mastering the debt-to-equity ratio calculation gives you a sharper perspective on a company’s strengths and potential risks. With practice, this ratio becomes a go-to tool for smarter financial decisions.
Real-World Examples: Debt-to-Equity Ratio in Action
Understanding the debt-to-equity ratio becomes much clearer when you see how it plays out in real companies. Let’s dive into real-world scenarios that show how this metric shapes business decisions and financial health.

Case Study 1: Low-Debt Company
Imagine a well-established manufacturing firm with $250,000 in total liabilities and $750,000 in shareholders’ equity. The debt-to-equity ratio here is 0.3. This low figure signals conservative financing. Lenders see such companies as stable and low-risk. Investors, meanwhile, might view the business as mature, perhaps missing out on higher growth opportunities due to minimal leverage.
A low debt-to-equity ratio often means the company relies more on its own capital than borrowed funds. While this reduces financial risk, it could also indicate an aversion to expansion or innovation, especially in fast-moving markets.
Case Study 2: High-Debt Company and Calculation Walkthrough
Now consider a tech startup aggressively expanding, with $900,000 in total liabilities and $100,000 in shareholders’ equity. Its debt-to-equity ratio soars to 9. This high ratio can be a double-edged sword. On one hand, it shows ambition and a willingness to fuel growth with debt. On the other, it raises red flags for creditors, as heavy debt increases default risk.
Let’s break down a sample balance sheet to see how this works in practice:
| Balance Sheet Item | Amount ($) |
|---|---|
| Current Liabilities | 865,000 |
| Long-Term Liabilities | 1,000,000 |
| Shareholders’ Equity | 620,000 |
The total liabilities add up to $1,865,000. Dividing this by $620,000 in equity, the debt-to-equity ratio is:
Debt-to-Equity Ratio = 1,865,000 / 620,000 = 3.01
A ratio above 3 can indicate aggressive borrowing—a strategy that may pay off if growth justifies the risk, or backfire if cash flows falter.
Industry-Specific Scenarios
What counts as a “normal” debt-to-equity ratio depends on industry norms. For example:
- Manufacturing: Often operates with higher ratios due to capital-intensive needs.
- Tech: May have lower ratios, relying more on equity funding.
- Services: Typically maintain moderate ratios, balancing debt and equity.
Banks and lenders scrutinize these ratios before approving loans. For an up-to-date look at typical ranges across sectors, see the Debt-to-Equity Ratio by Industry 2025. Comparing your company’s ratio to industry benchmarks is crucial for accurate analysis.
Strategic Decisions and Key Takeaways
The debt-to-equity ratio isn’t just a static number—it’s a tool that guides major decisions. Companies might adjust their capital structure before expansions, acquisitions, or restructuring. A high ratio might be justified in industries with stable cash flows, while a low ratio could signal missed growth in dynamic sectors.
Remember, context is everything. What’s risky in one industry may be standard in another. By mastering the debt-to-equity ratio, you’ll gain a clearer lens for evaluating business stability, risk, and growth prospects.
Interpreting the Debt-to-Equity Ratio: What the Numbers Really Mean
Gaining a clear perspective on the debt-to-equity ratio is essential for meaningful financial analysis. Numbers alone never tell the full story; it’s all about interpretation within the right context. Let’s break down what different ranges indicate, how industry benchmarks shape your understanding, and the common pitfalls to avoid.
Understanding Ratio Ranges and What They Indicate
The debt-to-equity ratio is more than just a number—it’s a window into a company’s financial philosophy and risk appetite. A low debt-to-equity ratio (for example, 0.3) suggests a conservative approach. Businesses with low ratios often rely more on equity than debt, signaling stability and possibly a mature stage of growth. However, this can also mean missed opportunities for expansion, as some experts argue that “very low ratios can mean a company isn’t taking advantage of leverage to maximize returns.”
On the other hand, a high debt-to-equity ratio (like 9) reflects aggressive borrowing. Such companies may be pursuing rapid growth or operating in capital-intensive industries. While this can boost returns for shareholders if things go well, it also raises the risk profile. Lenders may see these firms as risky, potentially leading to higher borrowing costs or stricter loan terms.
A moderate debt-to-equity ratio—typically around 2 to 2.5—is often considered balanced. For every dollar of equity, there’s roughly $2 in debt. This level is frequently cited as healthy, but it’s not a one-size-fits-all answer. Shareholders may push for higher leverage in search of greater returns, while lenders prioritize a ratio that ensures the company can service its debt comfortably. The debt-to-equity ratio is a balancing act for all parties involved.
Industry Benchmarks and Variability
What’s considered a “good” debt-to-equity ratio varies dramatically by industry. For instance, manufacturing firms often have higher ratios due to large capital needs, while tech companies, with lighter asset structures, tend to have lower ratios. Retailers and financial services each have their own standards shaped by business models and regulatory demands.
Here’s a quick look at typical industry benchmarks:
| Industry | Typical Debt-to-Equity Ratio |
|---|---|
| Manufacturing | 1.5 – 3.0 |
| Technology | 0.2 – 1.0 |
| Retail | 0.7 – 2.0 |
| Financial Services | 2.0 – 4.0 |
Regulatory environments and market expectations also play a role. For example, stricter lending rules may push companies toward lower ratios, while a booming market could see firms taking on more debt to fuel growth. To determine what’s healthy for your business, always compare your numbers to sector peers and market conditions. For a deeper dive into what makes a favorable ratio in 2025, check out this guide on Understanding a Good Debt-to-Equity Ratio in 2025.
Common Misinterpretations and Pitfalls
It’s easy to misread the debt-to-equity ratio if you don’t consider the full picture. One common mistake is focusing solely on the ratio without context. A sudden spike might be temporary, perhaps due to a one-time expense or investment, so it’s important to look at trends over time.
Another pitfall is ignoring off-balance-sheet liabilities, such as leases or contingent obligations. These can distort the true leverage if not accounted for. Additionally, a low debt-to-equity ratio isn’t always a positive sign. In some cases, it might indicate stagnation or reluctance to invest in future growth. Conversely, a high ratio can be justified in industries where heavy borrowing is the norm, or during strategic expansion phases.
To avoid missteps, always analyze the debt-to-equity ratio alongside other metrics and industry standards. A holistic approach ensures you’re not blindsided by numbers that look good—or bad—at first glance.
Beyond the Basics: Advanced Debt-to-Equity Analysis for 2025
To truly unlock the power of the debt-to-equity ratio, you need to move beyond basic calculations and embrace holistic, advanced analysis. In 2025, the landscape of financial decision-making demands more than just a surface-level glance at leverage. Integrating this core metric with others, using it strategically, and leveraging technology allows you to make smarter, faster, and more resilient choices.
Integrating Debt-to-Equity with Other Financial Ratios
Advanced financial analysis relies on context. While the debt-to-equity ratio provides a snapshot of a company’s leverage, pairing it with other metrics delivers a much richer story. For example, compare the debt-to-equity ratio with the quick ratio to assess both solvency and liquidity. If a firm shows a moderate debt-to-equity ratio but a weak quick ratio, it may face short-term liquidity risks despite long-term stability.
Here’s a simple table to illustrate how these ratios interact:
| Ratio | What It Measures | Why It Matters |
|---|---|---|
| Debt-to-Equity Ratio | Long-term leverage | Capital structure, risk appetite |
| Quick Ratio | Short-term liquidity | Immediate ability to cover obligations |
| Interest Coverage | Ability to pay interest on debt | Debt servicing capacity |
| Return on Equity | Profitability for shareholders | Efficiency of equity use |
Analyzing the debt-to-equity ratio alongside interest coverage often reveals hidden risk. For instance, a company with a reasonable debt-to-equity ratio but low interest coverage might struggle if interest rates rise. Tracking these ratios over time can uncover trends, such as increasing leverage or declining liquidity, that single-point analysis misses.
In practice, always use the debt-to-equity ratio as part of a larger toolkit. This approach enables you to identify not just risk, but also opportunities for optimization and growth.
Strategic Uses of Debt-to-Equity Ratio
Understanding the debt-to-equity ratio opens the door to more sophisticated strategic decisions. Business leaders use this metric to fine-tune capital structures, balancing debt and equity to achieve targeted returns while controlling risk. For example, a firm considering expansion may compare the benefits of new debt financing versus issuing additional shares.
Mergers, acquisitions, and restructuring strategies are also guided by the debt-to-equity ratio. A target company with a high ratio might be riskier, but could offer greater upside if managed well. Conversely, a low ratio could signal financial stability but limited growth potential.
Consider these strategic applications:
- Capital Structure Optimization: Adjusting the debt-to-equity ratio to lower the cost of capital and enhance value.
- Debt Financing vs. Equity Issuance: Deciding whether to borrow or issue stock based on current leverage and market conditions.
- Stakeholder Communication: Demonstrating financial health and risk management to investors, lenders, and partners.
- Pre-Investment Adjustment: Companies may actively manage their debt-to-equity ratio before major investments or public offerings to present an attractive risk profile.
Ultimately, using the debt-to-equity ratio strategically means seeing beyond the number itself—understanding its implications for growth, stability, and competitive positioning.
The Debt-to-Equity Ratio in Modern Financial Technology
The way we analyze the debt-to-equity ratio is evolving rapidly thanks to digital innovation. Today, automation and artificial intelligence make it possible to track ratios in real time, spot trends instantly, and predict future shifts with greater accuracy.
Modern financial software can pull live data from balance sheets, calculate the debt-to-equity ratio automatically, and even provide predictive insights. AI-driven tools flag anomalies, such as sudden spikes in leverage, and suggest corrective actions. These platforms also enable seamless integration with other financial metrics, making holistic analysis accessible to businesses of all sizes.
Emerging trends for 2025 include:
- Real-Time Dashboards: Instantly visualize changes in the debt-to-equity ratio and related metrics.
- Predictive Analytics: Use AI to forecast future leverage scenarios and their business impact.
- ESG Integration: Analyze how capital structure decisions align with sustainability and governance goals.
- Mobile Monitoring: Access key ratios on the go, empowering faster decision-making.
Harnessing these digital tools transforms the debt-to-equity ratio from a static figure into a dynamic driver of strategic success. As technology continues to advance, expect the metric to play an even more central role in shaping financial outcomes.
Frequently Asked Questions about Debt-to-Equity Ratio
Understanding the debt-to-equity ratio is crucial for anyone analyzing business finances in 2025. Below, you'll find clear answers to the most common questions about this essential metric.
What is considered a “normal” debt-to-equity ratio?
There’s no universal “normal” debt-to-equity ratio. Most healthy businesses fall between 1 and 2.5, but the ideal range depends on industry standards and company growth stage.
How often should businesses monitor their debt-to-equity ratio?
It’s smart to check the debt-to-equity ratio every quarter, or whenever there’s a major change in financing or business direction. Regular monitoring helps you spot trends and respond quickly.
Can a company have a negative debt-to-equity ratio?
Yes, if shareholders’ equity is negative (liabilities exceed assets), the debt-to-equity ratio will also be negative. This often signals financial distress and is a red flag for investors.
How does the debt-to-equity ratio affect loan applications and investor decisions?
Lenders and investors use the debt-to-equity ratio to evaluate financial risk. A very high ratio might mean the company struggles to secure loans, while a very low one could suggest missed growth opportunities. For real-world context, check out the Debt-to-Equity Ratio Analysis for S&P Global to see how this ratio is tracked over time.
What’s the difference between debt-to-equity ratio and debt ratio?
The debt-to-equity ratio compares total liabilities to shareholders’ equity, while the debt ratio compares total liabilities to total assets. Both are useful, but each offers a different perspective on leverage.
How do dividends and retained earnings impact the debt-to-equity ratio?
Paying dividends reduces retained earnings, which may lower shareholders’ equity and increase the debt-to-equity ratio. Retained earnings boost equity, potentially lowering the ratio.
Are there circumstances where a high debt-to-equity ratio is advantageous?
Yes, in capital-intensive industries or during expansion, a higher debt-to-equity ratio can support growth. Companies may use more debt if returns exceed borrowing costs.
Can startups and established firms use the debt-to-equity ratio differently?
Absolutely. Startups often have higher ratios due to early borrowing and lower equity, while established firms might aim for stability with a lower debt-to-equity ratio. Context always matters.
Resources and Tools for Mastering Debt-to-Equity Analysis
Mastering the debt-to-equity ratio isn’t a one-and-done task. With financial landscapes evolving rapidly, the right resources and tools can make a world of difference as you analyze, calculate, and interpret this crucial metric.
Templates, Calculators, and Further Reading
Having reliable tools at your fingertips streamlines debt-to-equity ratio analysis. Here are some of the most useful resources:
Online Calculators
- Many reputable sites, like BDC and CFI, offer free debt-to-equity ratio calculators. These tools allow you to input liabilities and equity figures quickly, minimizing manual errors and saving time.
- Look for calculators that let you adjust for different business structures or add notes to your results.
Spreadsheet Templates
- Downloadable templates make it easy to monitor debt-to-equity ratio trends over time. A good template will auto-calculate the ratio as you update your balance sheet data.
- Templates can also help you visualize trends and compare values across reporting periods.
Guides and Tutorials
- Step-by-step guides demystify the process of reading and analyzing balance sheets. These resources break down the components of liabilities and equity, giving you clarity on what goes into the debt-to-equity ratio formula.
- Video tutorials and webinars can offer practical walkthroughs, especially for those new to financial analysis.
Books, Courses, and Certifications
- Comprehensive books on financial statement analysis often dedicate entire chapters to the debt-to-equity ratio and related metrics.
- Online courses (such as those from Coursera or LinkedIn Learning) provide structured learning paths, from beginner to advanced.
- Consider certifications in financial analysis if you want to deepen your expertise or boost your credentials.
Industry Reports and Benchmark Sources
- Accessing up-to-date industry reports is crucial for benchmarking your debt-to-equity ratio against sector peers. Look for annual reports, market analyses, and financial databases relevant to your industry.
- Many organizations publish benchmark ranges for key financial ratios, helping you interpret your company’s position more accurately.
| Resource Type | Example Tools/Sources | Purpose |
|---|---|---|
| Calculator | BDC, CFI | Quick, accurate ratio calculation |
| Spreadsheet Template | Excel, Google Sheets | Ongoing tracking and trend analysis |
| Guide/Tutorial | Investopedia, YouTube | Step-by-step learning and clarification |
| Industry Benchmark | Industry reports, market analytics | Contextual performance comparison |
| Certification | CFA, CPA, online finance courses | Professional development and credibility |
Staying Updated and Integrating Tools into Practice
The debt-to-equity ratio landscape is constantly shifting due to changing regulations, market volatility, and new financial products. Stay on top of these changes by:
- Setting up alerts for regulatory updates or industry best practices.
- Subscribing to financial news sources and professional newsletters.
- Regularly reviewing and updating your templates as new guidance emerges.
Integrating debt-to-equity ratio analysis into your regular business reviews ensures you’re not caught off guard by sudden shifts in your capital structure. Using a combination of calculators, templates, and benchmarking data, you can spot trends early and adapt your financial strategy with confidence.
When exploring debt management strategies, understanding concepts like What is a sinking fund? can provide additional context for how companies plan for and manage their long-term obligations—an essential complement to debt-to-equity ratio analysis.
Where to Find Sector-Specific Data and Benchmarks
Finding the right benchmarks is key to interpreting your debt-to-equity ratio effectively. Start with:
- Industry association reports and databases.
- Government and regulatory bodies that publish sector averages.
- Financial news platforms that offer ratio comparisons by industry.
If your business operates across multiple sectors, consider segmenting your analysis to match each industry’s standards. This nuanced approach helps avoid misleading conclusions and supports better decision-making.
By leveraging these resources and tools, you’ll be well-equipped to monitor, interpret, and act on your debt-to-equity ratio—no matter how complex your business or the market becomes.
Now that you’ve got the tools to master debt-to-equity analysis, imagine being able to spot patterns and learn from real market history—just like we explored in the guide. If you’re curious to see how these insights play out across decades of financial ups and downs, why not get hands-on with our new platform? You’ll get access to interactive charts, AI-powered summaries, and original context—all designed to help you make smarter decisions. We’re building this for people like you who want to learn from the past to shape the future. Join Our Beta