
Ratio Analysis Guide: Master Financial Insights in 2025
Unlock the secrets behind every successful business decision by mastering ratio analysis. In today's volatile economy, financial insight is more crucial than ever for staying ahead in 2025.
This guide demystifies ratio analysis, empowering business leaders, investors, students, and finance professionals to interpret financial statements, benchmark performance, and make data-driven decisions. You will discover core concepts, explore essential ratio categories, and gain step-by-step strategies for real-world application.
Ready to gain a competitive financial edge? Learn, apply, and excel with the latest ratio analysis techniques for the evolving market landscape.
The Fundamentals of Ratio Analysis
Unlocking the full potential of financial statements starts with understanding the fundamentals of ratio analysis. Whether you are a business leader, investor, or finance student, mastering these basics is crucial for interpreting data and making smart decisions.
What is Ratio Analysis?
Ratio analysis is the process of evaluating a company’s financial health by comparing key numerical metrics from its financial statements. This technique has evolved over decades to become a cornerstone of modern finance, offering a universal language for investors, managers, and analysts alike.
Historically, ratio analysis was often used to compare companies of similar size or industry, revealing strengths and weaknesses that raw numbers alone cannot show. For example, two firms with identical revenues can have vastly different profit margins, highlighting operational differences.
Ratio analysis is invaluable for both internal and external stakeholders. Internally, managers use it to identify performance gaps and set strategies. Externally, investors, lenders, and regulators rely on ratios to make informed decisions. In fact, research shows that 80% of financial analysts use ratio analysis as a primary evaluation tool. For a deeper dive into its history and methodologies, consult this Financial Ratio Analysis: A Literature Review.
Why Ratio Analysis Matters in 2025
In 2025, the complexity of global markets and financial statements is at an all-time high. Companies operate in rapidly changing environments, where data-driven decision-making can make or break success. Ratio analysis offers a way to cut through the noise and reveal the true story behind the numbers.
As regulatory demands for transparency increase, ratio analysis helps organizations stay compliant and spot potential issues early. For instance, ratios can highlight red flags before a financial crisis unfolds, giving decision-makers time to act.
Another key trend is the integration of ESG (Environmental, Social, Governance) data into financial analysis. Stakeholders now expect companies to demonstrate sustainability and ethical performance, making ratio analysis even more relevant. Despite advances in technology, ratio analysis remains an essential tool for interpreting both financial and non-financial information in a digital world.
Core Principles and Limitations
Effective ratio analysis is built on three core principles:
- Objectivity: Ratios must use reliable, standardized data.
- Comparability: Benchmarks against industry peers are vital.
- Context: Ratios are best used as starting points for deeper analysis.
However, ratio analysis comes with limitations. Results often reflect historical performance, which may not predict future trends. Industry variations and seasonal factors can distort ratios, requiring careful adjustment. For example, inventory turnover is critical in retail but less meaningful for software firms.
More than 60% of analysts say industry differences pose the biggest challenge in ratio analysis. The best approach combines quantitative ratios with qualitative insights, such as management quality and market dynamics. Remember, no ratio provides all the answers alone.
Types of Ratio Analysis: An Overview
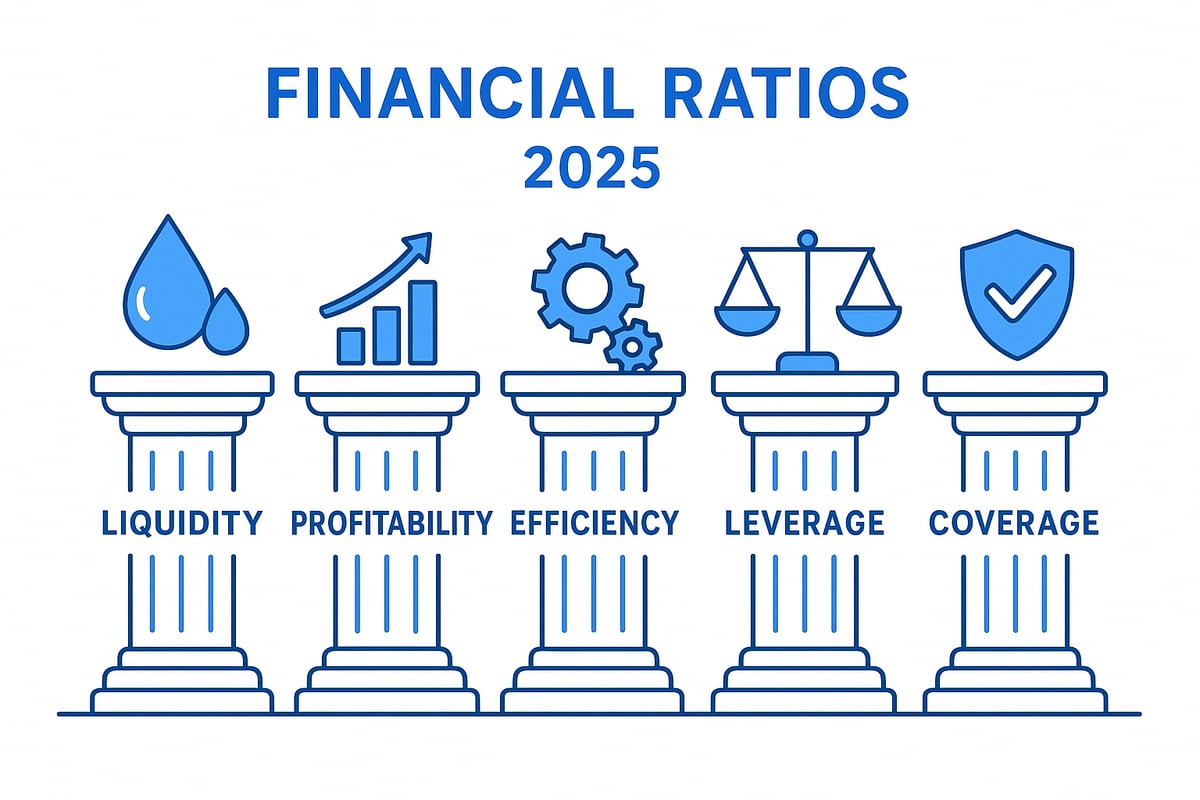
Ratio analysis consists of several key categories, each addressing specific financial questions:
| Category | Key Ratios | Financial Question Answered |
|---|---|---|
| Liquidity | Current, Quick, Cash | Can the company pay short-term debts? |
| Profitability | Gross Margin, ROE, ROA | Is the company generating strong returns? |
| Efficiency | Inventory Turnover, Asset Turnover | How well are resources managed? |
| Leverage | Debt-to-Equity, Debt Ratio | How much risk does the company carry? |
| Coverage | Interest Coverage | Can it meet its financial obligations? |
For example, liquidity ratios reveal solvency, while profitability ratios show growth potential. Importantly, these categories are interconnected; relying on one ratio alone can be misleading.
Studies show that companies using multi-ratio analysis outperform peers by 15%. Adopting a holistic approach to ratio analysis ensures comprehensive insights and better decision-making. In the following sections, we will explore each ratio category in detail.
Key Categories of Financial Ratios
Unlocking the power of ratio analysis means understanding the core categories that shape financial decision-making. Each category answers specific questions about a company's financial health, performance, and long-term viability. By mastering these categories, you can make data-driven choices and spot opportunities or risks that others might miss.
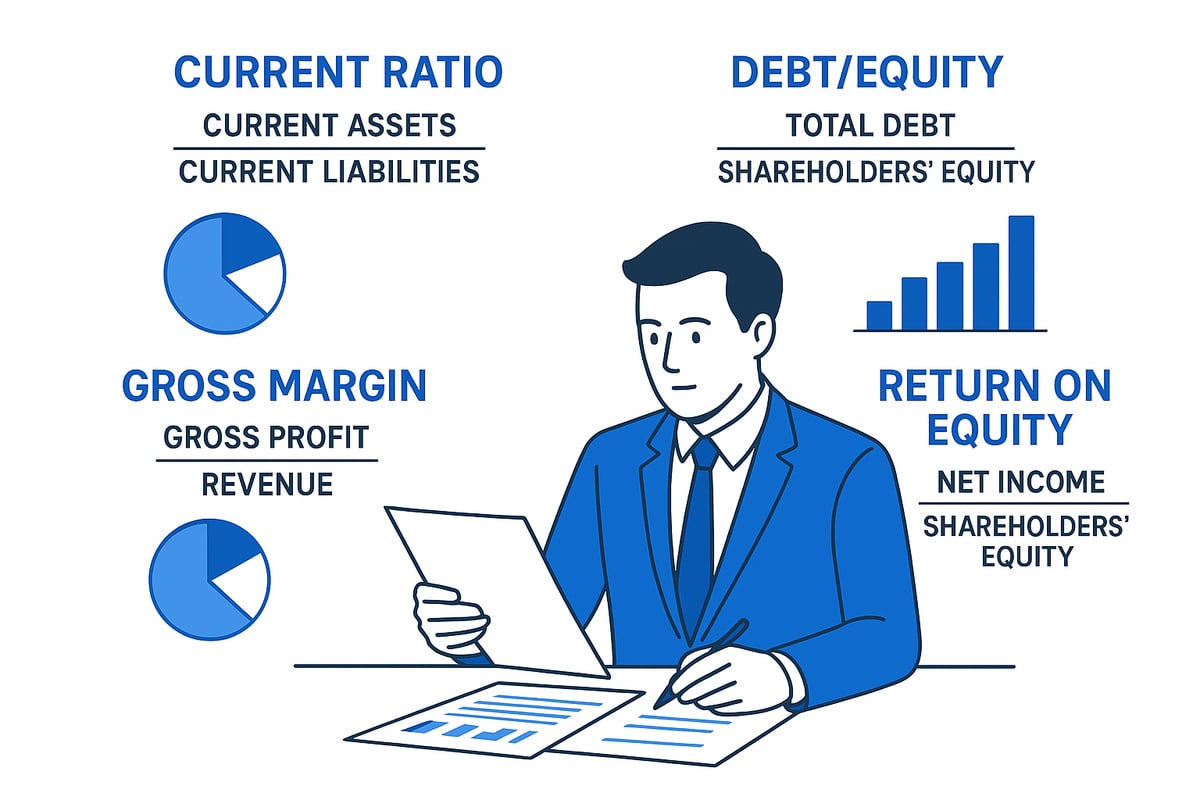
Liquidity Ratios: Assessing Short-Term Health
Liquidity ratios measure a company's ability to meet immediate financial obligations. These ratios are essential in ratio analysis for evaluating whether a business can pay its bills on time. The most common liquidity ratios include the current ratio, quick ratio, and cash ratio.
For example, the current ratio is calculated as current assets / current liabilities. If a hypothetical company has $200,000 in current assets and $100,000 in current liabilities, its current ratio is 2.0. This indicates strong short-term financial health.
Creditors and suppliers closely monitor liquidity ratios because they reveal solvency risk. Typical healthy ranges vary by industry, but a current ratio below 1.0 is a red flag for 75% of lenders. Not all assets are easily converted to cash, so the quick ratio for liquidity analysis offers a more conservative perspective by excluding inventory.
Understanding liquidity through ratio analysis helps businesses maintain trust with stakeholders and avoid shortfalls.
Profitability Ratios: Measuring Business Success
Profitability ratios assess a company's ability to generate earnings relative to sales, assets, or equity. In ratio analysis, these metrics are crucial for investors and managers seeking sustainable growth.
Key profitability ratios include:
- Gross margin
- Net profit margin
- Return on assets (ROA)
- Return on equity (ROE)
- Return on investment (ROI)
Consider two competitors: Company A has a net profit margin of 12%, while Company B's is 8%. Company A is more efficient at converting revenue into profit. The average net profit margin for S&P 500 companies is 10.7% (2024 data), setting a useful benchmark.
While high profitability often signals strength, it can sometimes hide operational or market risks. Profitability is a central focus of ratio analysis because it drives stock valuation and investment decisions.
Efficiency and Activity Ratios: Operational Effectiveness
Efficiency and activity ratios show how effectively a company manages its assets and liabilities. These ratios are vital in ratio analysis for highlighting operational strengths or weaknesses.
Main ratios in this category:
- Inventory turnover
- Accounts receivable turnover
- Asset turnover
For instance, a retailer turning over inventory eight times per year is more efficient than one with a turnover of four. Best-in-class companies often turn inventory twice as fast as industry averages.
However, industry-specific benchmarks are critical, as what is efficient in one sector may not be in another. Efficiency ratios in ratio analysis reveal how well a business uses resources to generate revenue and control costs.
Leverage and Solvency Ratios: Long-Term Stability
Leverage and solvency ratios evaluate a company's use of debt and its ability to meet long-term obligations. These are central to ratio analysis when assessing financial risk.
Key ratios include:
- Debt-to-equity ratio
- Interest coverage ratio
- Debt ratio
For example, a capital-intensive firm with a debt-to-equity ratio of 2.5 is at higher risk than one with a ratio of 1.0. Statistics show bankruptcy risk increases by 30% when debt-to-equity exceeds 2.0.
High leverage can amplify both gains and losses, requiring careful analysis. Ratio analysis in this area helps balance growth ambitions with financial stability.
Coverage Ratios: Meeting Financial Obligations
Coverage ratios measure a company's capacity to service its debt and fixed charges. In ratio analysis, these are leading indicators of potential solvency issues.
Primary coverage ratios:
- Interest coverage ratio
- Fixed-charge coverage ratio
Suppose a tech company has an interest coverage ratio of 2.0, meaning it earns twice as much as needed to pay interest expenses. An interest coverage below 1.5 often signals financial distress.
Non-cash expenses can distort these ratios, so analysts must interpret results carefully. Coverage ratios in ratio analysis help creditors and bondholders assess risk before extending loans.
Additional Ratio Types: Market and ESG Metrics
Beyond traditional categories, ratio analysis now includes market-based ratios and ESG (Environmental, Social, Governance) metrics.
Common examples:
- Price-to-earnings (P/E) ratio
- Price-to-book (P/B) ratio
For instance, investors use P/E ratios to assess whether a stock is over- or undervalued. ESG ratios are gaining prominence in 2025 as sustainable investing grows. Market ratios can be influenced by sentiment or external factors, so context is key in ratio analysis.
Choosing the Right Ratios for Your Analysis
Selecting the best ratios for ratio analysis depends on industry, company size, business model, and stakeholder priorities. For example, a retail business focuses on inventory turnover, while a SaaS company prioritizes recurring revenue ratios.
Trend analysis and industry benchmarks enhance insight. Customizing your approach ensures relevance and actionable outcomes. Research shows that tailored ratio analysis increases actionable insights by 40%.
A holistic, context-driven ratio analysis approach empowers better decision-making and long-term financial success.
Step-by-Step Guide to Performing Ratio Analysis in 2025
Unlocking the full potential of ratio analysis requires a disciplined, methodical approach. In this section, we walk through a modern, actionable process tailored for 2025, ensuring you extract meaningful insights from every financial statement. Let’s break down each step for effective implementation.

Step 1: Gather and Prepare Financial Data
Begin your ratio analysis journey by collecting the three essential financial statements: the balance sheet, the income statement, and the cash flow statement. Accuracy is crucial, so ensure data consistency and compliance with GAAP or IFRS standards.
Adjust for any non-recurring events or accounting changes. For instance, if a company reports a one-time asset sale, normalize the earnings to reflect ongoing operations. Leveraging financial databases and reliable software tools minimizes errors.
Did you know that 90 percent of mistakes in ratio analysis originate from inconsistent data? For a deeper dive into the structure and components of an income statement, refer to this Income statement fundamentals resource.
Step 2: Select Relevant Ratios and Benchmarks
Next, align your ratio analysis with your specific objectives. Are you evaluating liquidity, profitability, or efficiency? Choose ratios that directly support your goals.
Selecting appropriate industry benchmarks and timeframes is equally important. For example, compare a company’s current ratio to the industry median over several years. Historical data helps identify meaningful trends rather than isolated figures.
The right benchmarks transform raw numbers into actionable insights, ensuring your ratio analysis remains relevant and comparable.
Step 3: Calculate Ratios Accurately
With your data and benchmarks ready, calculate each ratio using the standard formulas. Double-check your math to avoid costly mistakes.
For example, to compute Return on Equity (ROE), divide net income by shareholder equity. Use spreadsheet templates or financial calculators to increase efficiency and reduce manual errors.
Keep in mind, manual calculation errors still account for 15 percent of misinterpretations in ratio analysis. Precision in this step sets the foundation for reliable results.
Step 4: Analyze, Interpret, and Compare Results
Now, put your ratio analysis findings into context. Start by comparing each ratio to historical company data and industry standards. Look for trends, outliers, and potential red flags.
Suppose you notice a declining gross margin despite rising sales. This could indicate rising costs or pricing pressure. Peer comparisons help illuminate strengths and weaknesses, while qualitative factors like market shifts or management changes provide deeper perspective.
Remember, interpretation is as critical as calculation. Companies that monitor ratio analysis trends quarterly outperform those reviewing annually by 18 percent. By blending quantitative results with business context, you transform ratios into strategic intelligence.
Step 5: Draw Actionable Insights and Make Decisions
The core value of ratio analysis lies in turning numbers into decisions. Translate your findings into strategic recommendations—perhaps suggesting liquidity improvements to secure favorable loan terms, or reallocating resources based on efficiency metrics.
Present your insights to stakeholders using clear visuals and concise narratives. Use ratio analysis to inform budgeting, investment, and risk management decisions.
Ultimately, actionable ratio analysis empowers confident, informed leadership. Businesses that embrace this approach reduce financial missteps by 25 percent, gaining a measurable advantage.
Step 6: Monitor and Update Regularly
Establish a consistent routine for ratio analysis, whether monthly or quarterly. Adapt your review process to account for seasonality and evolving market conditions.
For example, track inventory turnover more frequently during peak retail seasons. Automated dashboards and reporting tools streamline ongoing analysis, ensuring you respond quickly to emerging trends.
Continuous monitoring of ratio analysis safeguards your organization’s financial agility in a rapidly changing environment.
Real-World Applications and Case Studies
Unlocking the full value of ratio analysis requires moving from theory to practice. In this section, explore how ratio analysis directly impacts investment, lending, business management, mergers, and industry-specific strategies. Learn from real-world scenarios and avoid common mistakes as you apply ratio analysis in 2025.

Ratio Analysis for Investors and Lenders
Investors and lenders rely on ratio analysis as a foundation for evaluating opportunities and risks. By dissecting key ratios such as return on equity (ROE) and price-to-earnings (P/E), investors can identify growth stocks and assess long-term value. Lenders, on the other hand, scrutinize liquidity and coverage ratios to determine a borrower's ability to repay.
For example, a lender may require a minimum current ratio to approve a business loan, while an investor might compare ROE across industry peers before buying shares. In fact, 85% of lenders cite ratio analysis as a primary decision factor. For practical resources and methodologies to deepen your skills, the Ratio Analysis Research Guide offers a comprehensive starting point.
Business Performance Management with Ratios
Within organizations, ratio analysis drives smarter decision-making. Managers use ratios to pinpoint inefficiencies, monitor profit drivers, and set realistic performance targets. For instance, tracking asset turnover helps optimize supply chains and reduce working capital needs.
Ratio analysis empowers leaders during budgeting and forecasting, enabling data-driven strategic planning. Companies that integrate ratio analysis into their management routines experience, on average, a 12% higher ROI. Regular monitoring of ratios ensures emerging problems are caught early, allowing for proactive management instead of reactive fixes.
Ratio Analysis in Mergers, Acquisitions, and Valuations
In mergers and acquisitions, ratio analysis is indispensable for due diligence and valuation. Analysts evaluate targets by examining leverage ratios, profitability, and market-based metrics to uncover hidden strengths or risks. For example, an acquirer might prioritize targets with low debt-to-equity and high return on assets (ROA).
Comprehensive ratio reviews help determine fair deal terms and identify integration challenges. Notably, 70% of successful M&A transactions utilize detailed ratio analysis throughout negotiations. By comparing price-to-book and ROA, buyers can spot undervalued companies and avoid overpaying. This approach reduces surprises and increases the chances of post-merger success.
Industry-Specific Ratio Insights
Different industries demand a tailored approach to ratio analysis. In retail, inventory turnover and gross margin are essential for tracking product movement and profitability. SaaS and tech companies focus on recurring revenue ratios and customer acquisition costs, reflecting their subscription-based models.
Manufacturers prioritize efficiency ratios like fixed asset turnover to maximize production capacity. Comparing ratio priorities across sectors highlights the importance of context. Customizing ratio analysis to each industry ensures insights are relevant and actionable, helping businesses maintain a competitive edge.
Common Pitfalls and How to Avoid Them
Despite its power, ratio analysis has pitfalls. Overreliance on a single ratio often leads to incomplete conclusions. Ignoring qualitative factors or market shifts can skew results.
For example, high leverage may be acceptable in capital-intensive sectors but risky elsewhere. To avoid mistakes, always corroborate ratio analysis with broader financial and strategic review.
Emerging Trends in Ratio Analysis for 2025
The landscape of ratio analysis is rapidly evolving in 2025. New technologies, data sources, and global priorities are reshaping how professionals interpret financial health. Staying ahead means understanding not just the fundamentals, but also the innovations driving change.
Integration of AI and Automation in Ratio Analysis
Artificial intelligence is revolutionizing ratio analysis. In 2025, AI-powered tools can instantly process vast data, highlight anomalies, and generate actionable insights in seconds. For example, automated systems now flag irregularities in financial ratios, helping analysts detect issues before they escalate.
Key benefits include improved speed, greater accuracy, and the ability to scale analysis across portfolios. AI also enables predictive modeling, forecasting future performance using historical ratio data. According to industry estimates, AI adoption in finance will grow by 35 percent this year.
However, automation does not replace human expertise. Analysts must interpret AI-generated results, ensuring context and judgment remain central. For a deeper dive into this topic, see Predictive AI for Financial Performance Management, which explores how AI enhances traditional ratio analysis.
ESG and Non-Financial Metrics
Environmental, social, and governance (ESG) factors are now critical in ratio analysis. Investors and regulators demand transparency beyond financial numbers, prompting the rise of ESG ratios such as carbon emissions per revenue dollar.
In 2025, 60 percent of institutional investors incorporate ESG ratios into their decision-making. These metrics provide a more holistic view of company performance, highlighting risks and opportunities that traditional ratios may miss.
ESG ratios are rapidly shaping investment strategies. Integrating non-financial data with conventional analysis ensures businesses remain competitive and accountable in a values-driven market.
Real-Time and Predictive Ratio Analysis
The shift from static, historical data to real-time ratio analysis is transforming financial management. Modern dashboards update key ratios daily, giving decision-makers instant feedback on liquidity, profitability, and solvency.
Predictive analytics take this further by forecasting future trends based on current and historical ratio patterns. Firms leveraging predictive ratio analysis have reduced risk exposure by 20 percent, according to recent studies.
Despite these advances, data quality and system integration remain challenges. Still, the move toward real-time insights keeps organizations agile and proactive in a fast-changing environment.
The Role of Education and Continuous Learning
Mastering ratio analysis in 2025 requires ongoing education. With rapid advancements in analytics tools and methodologies, finance professionals must regularly update their skills.
Online courses, certifications, and workshops are now standard for staying competitive. In fact, 75 percent of finance experts pursue continuing education to keep up with evolving trends.
Continuous learning is not just beneficial, it is essential. Those who invest in their ratio analysis expertise set themselves apart in a crowded and dynamic field.
Frequently Asked Questions About Ratio Analysis
Gaining clarity on ratio analysis can transform how you evaluate business health, make investment decisions, and avoid costly mistakes. Below, you will find answers to the most common questions, designed to help you confidently apply ratio analysis in 2025.
What is the most important ratio for business health?
The answer depends on your goal. For liquidity, the current ratio is often critical, while return on equity (ROE) is key for assessing profitability. For solvency, many analysts use the debt-to-equity ratio definition to evaluate long-term risk. In some cases, a combination of ratios gives the clearest picture.
How often should ratios be analyzed?
Best practice is to conduct ratio analysis monthly for operational oversight and quarterly for strategic planning. Regular monitoring helps you spot trends early and respond proactively.
Can ratio analysis predict financial crises?
Ratio analysis can highlight warning signs, such as declining liquidity or rising debt levels, before problems escalate. However, it should be used alongside other tools and not as the sole predictor of crises.
Are ratios comparable across industries?
Ratios are most useful when benchmarked against industry peers. Each sector has unique standards, so always compare similar businesses to ensure relevant insights.
How do non-financial factors affect ratio analysis?
Qualitative factors, like management changes or market shifts, can influence results. Integrating these insights with quantitative data leads to more accurate conclusions.
What tools and software are recommended for ratio analysis in 2025?
Modern platforms offer automated ratio calculations, benchmarking, and data visualization. Look for solutions that support GAAP or IFRS standards and provide customizable dashboards.
How can small businesses leverage ratio analysis?
Start with a few key ratios, such as current ratio and net profit margin, and track them consistently. Simple spreadsheet templates or online calculators can make ratio analysis accessible and actionable for small firms.
What are the main pitfalls to avoid?
- Relying on a single ratio without context
- Ignoring industry benchmarks
- Overlooking data quality issues
- Failing to consider qualitative factors
For market valuation, the price-to-earnings ratio overview is a reliable starting point, but always use it with other metrics for a well-rounded assessment.
By understanding these essentials, you can use ratio analysis to make informed decisions, minimize risk, and gain a true edge in the evolving financial landscape.
As you’ve seen throughout this guide, mastering ratio analysis is key to making confident, data-driven financial decisions in 2025. Whether you’re an investor, student, or business leader, understanding the stories behind the numbers can give you a real edge. At Historic Financial News, we’re building a platform to let you explore market history through interactive charts, AI-powered insights, and original reporting—so you can spot patterns and make smarter moves. If you’re passionate about deepening your financial perspective and want to shape the future of financial analysis, Join Our Beta and be among the first to experience our unique tool.