
IRR Guide 2025: Mastering Internal Rate of Return Essentials
Curious how top investors and business leaders consistently make smarter investment choices in 2025? The secret often lies in mastering irr, a metric that goes beyond basic returns to reveal the true potential of any opportunity.
This guide will demystify irr for you, breaking down what it is, why it matters, and how to interpret, calculate, and apply it in real-world scenarios. We will explore calculation methods, practical applications, common pitfalls, and advanced strategies to help you maximize your investment outcomes.
Whether you work in finance, real estate, or private equity, understanding irr is essential for making sound decisions. Dive in and gain the actionable knowledge you need to master irr essentials for 2025.
Understanding Internal Rate of Return (IRR)
Curious about how irr shapes modern investment decisions? The internal rate of return, or irr, is a cornerstone concept that helps investors, business leaders, and analysts evaluate opportunities across industries. To fully leverage irr, it's essential to understand its definition, why it matters in 2025, and how it compares to other financial metrics.
What Is IRR?
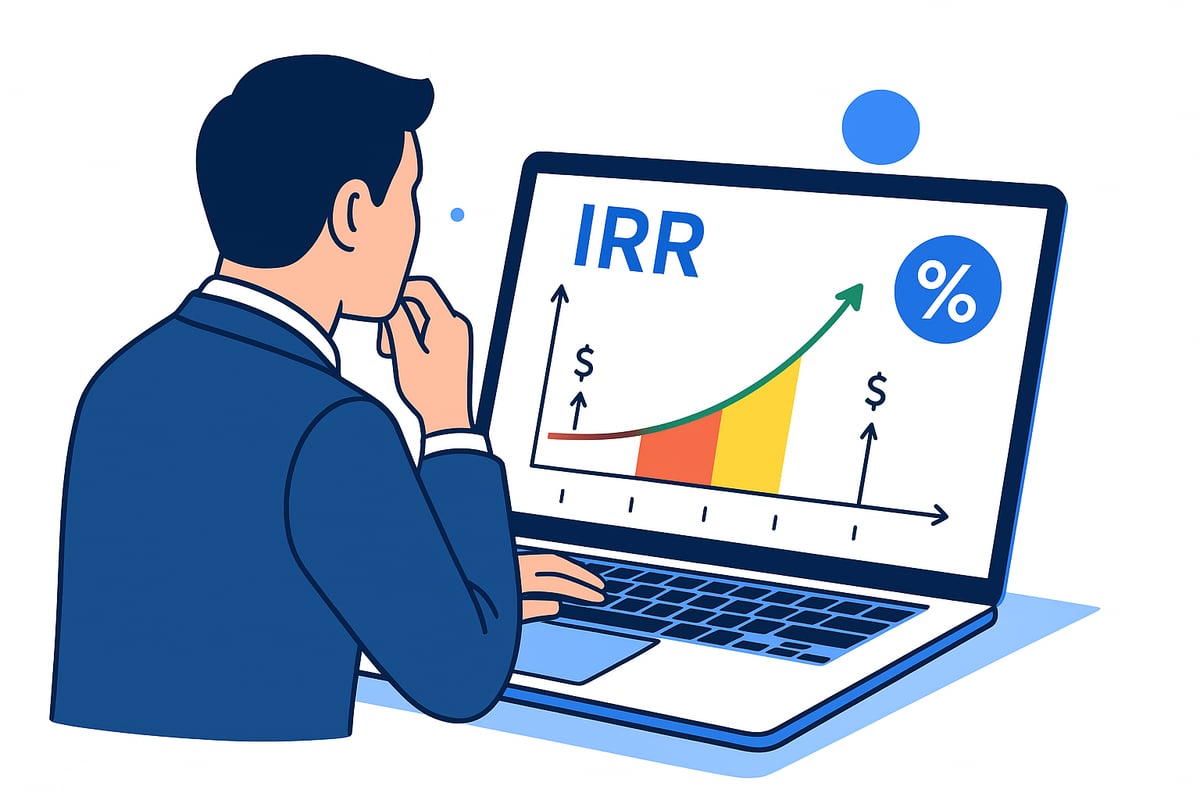
The irr, or internal rate of return, is defined as the discount rate that makes the net present value (NPV) of a series of cash flows equal to zero. In practical terms, irr represents the annualized effective compounded return that an investment is expected to generate.
Unlike basic return metrics, irr takes the timing and size of each cash flow into account. For example, if you invest $100,000 today and receive $161,051 in five years, your irr is 10 percent. This means each dollar invested grows at a 10 percent compound rate annually over the period.
Irr stands apart from metrics like return on investment (ROI) and compound annual growth rate (CAGR). ROI measures total percentage return without regard for time, while CAGR shows average annual growth but does not handle varying cash flows. Irr, on the other hand, captures the impact of when cash flows occur, making it highly valuable for dynamic investments.
Irr is especially popular in finance, private equity, and real estate, where understanding the efficiency of capital over time is critical. It serves as an internal measure, focusing solely on project-specific returns and ignoring external factors such as inflation or market volatility. For those new to these terms, the Key finance terms glossary can provide helpful definitions.
Why IRR Matters in 2025
In 2025, irr remains a universal benchmark for comparing investment opportunities, whether in corporate finance, real estate, or venture capital. Investors and managers use irr to assess which projects or assets are likely to deliver the most value over time.
One key application is in setting hurdle rates—the minimum acceptable return required for an investment to proceed. If a project's irr exceeds the hurdle rate, it clears the threshold for consideration. Otherwise, it may be rejected in favor of alternatives. This process is fundamental in capital budgeting, mergers, and acquisitions.
Irr is also vital for evaluating decisions such as equipment upgrades, property developments, and new product launches. The metric helps ensure that expected returns outpace the cost of capital, which is essential for sustainable growth. According to SmartAsset, all else being equal, a higher irr signals a more attractive investment.
However, there are important limitations. Irr should not be used in isolation, as it does not account for investment size, risk, or external economic conditions. For example, two projects with identical irr values may have very different risk profiles or total returns. Recognizing these limitations is crucial for sound decision-making.
IRR vs. Other Investment Metrics
While irr is a powerful tool, it is most effective when used alongside other financial metrics. The main alternatives include net present value (NPV), compound annual growth rate (CAGR), and return on investment (ROI).
Below is a quick comparison:
| Metric | What It Measures | Time Value of Money | Considers Cash Flow Timing | Expressed As |
|---|---|---|---|---|
| IRR | Annualized return that sets NPV to zero | Yes | Yes | Percent (%) |
| NPV | Present value of all future cash flows | Yes | Yes | Currency ($) |
| ROI | Total return relative to investment | No | No | Percent (%) |
| CAGR | Average annual growth rate | Yes | No | Percent (%) |
For instance, two investments may both show a 10 percent irr, but if their cash flow patterns differ, the actual total profit can vary significantly. Additionally, irr does not always match CAGR, especially when cash flows are uneven or irregular.
The key insight is that irr should be considered part of a broader analysis, incorporating NPV and other relevant metrics. This approach ensures a holistic view and reduces the risk of misinterpreting results.
The IRR Formula and How It Works
Understanding the IRR formula is essential for anyone evaluating investments. This section will demystify how the formula works, clarify its components, and walk you through practical calculation methods. By mastering these steps, you will gain the confidence to interpret IRR results across a range of investment scenarios.
The IRR Formula Explained
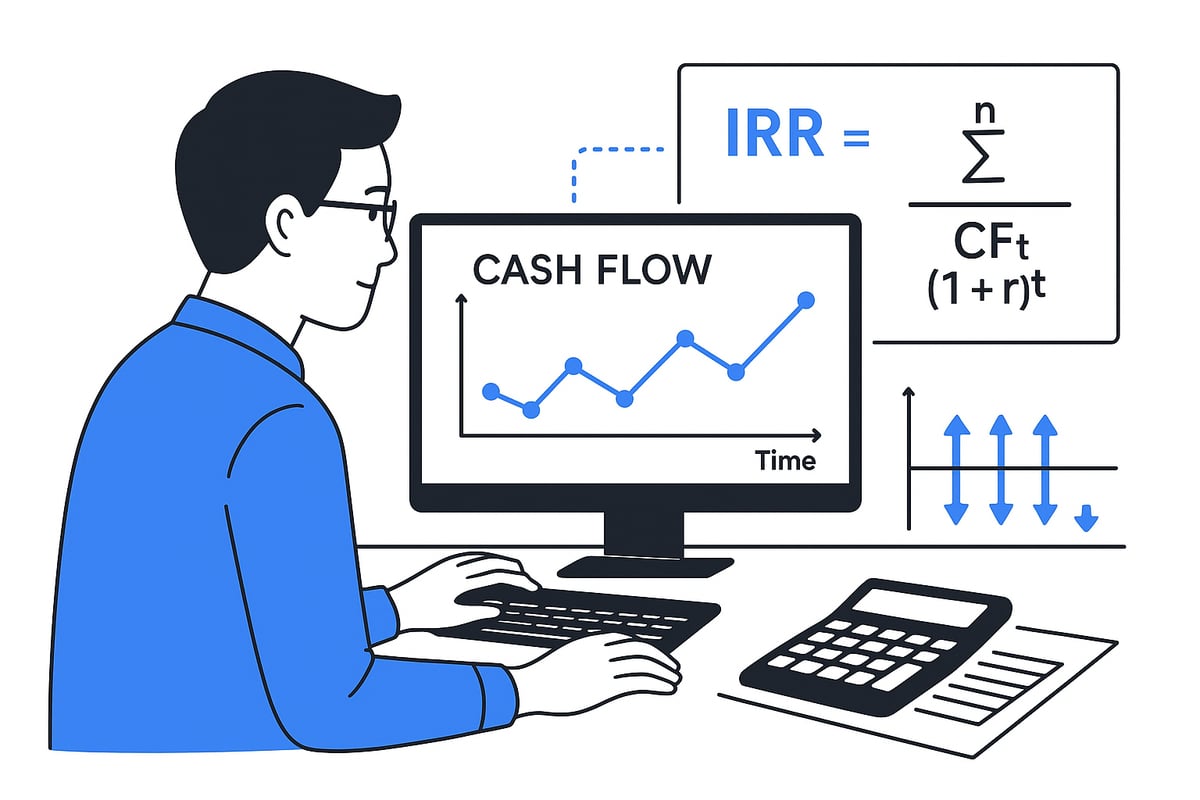
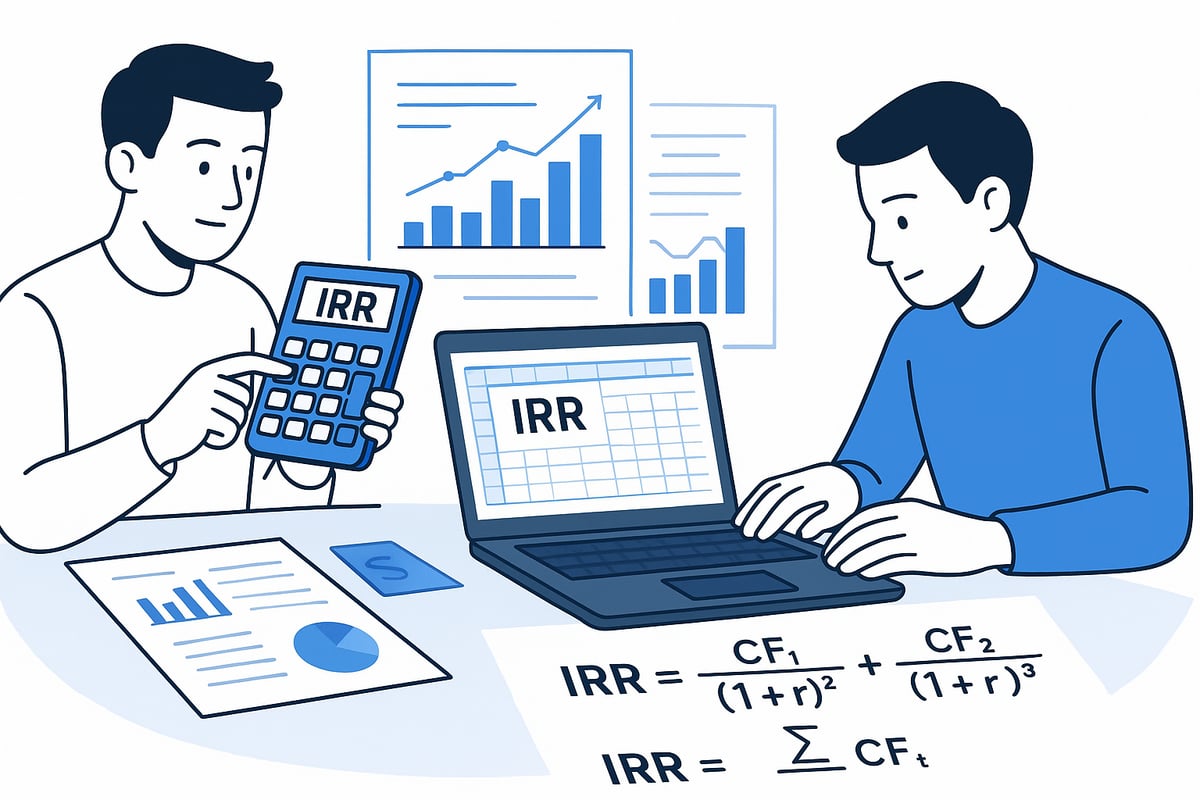
At its core, the IRR formula is designed to find the discount rate that sets the net present value (NPV) of a series of cash flows to zero. This rate reflects the annualized effective return generated by an investment. The formula is expressed as:
NPV = 0 = Σ [Cash flow_t / (1 + IRR)^t]
Let’s break down each component:
| Component | Description |
|---|---|
| Cash flow_t | The net cash flow at time period t |
| IRR | The internal rate of return (unknown, to be solved) |
| t | The time period (year, month, etc.) |
Suppose you invest $100,000 today and receive $30,000 annually for five years. The IRR is the rate that makes the sum of these discounted cash flows exactly zero. This calculation is iterative, requiring you to adjust the rate until the NPV equals zero.
For a deeper dive into practical applications and limitations, refer to the Application Analysis of IRR in Project Investment.
Net Present Value (NPV) and Its Relationship to IRR
NPV is the present value of all expected benefits minus the initial cost of an investment. The IRR is the specific rate at which the NPV becomes zero. This means the present value of all inflows equals the outflows.
For example, if you pay $100,000 upfront and receive future inflows, the IRR is the break-even return rate. If the IRR exceeds your required return, the project is attractive. If not, it likely warrants a second look.
NPV and IRR are often used together. While IRR gives you a percentage yield, NPV tells you how much value a project creates in present-day terms. These metrics provide complementary insights for robust investment analysis.
Step-by-Step Guide: Calculating IRR
Calculating IRR typically involves a trial-and-error process. Here’s how you do it:
- Guess a discount rate and calculate the NPV.
- If NPV is above zero, try a higher rate; if below, try a lower rate.
- Repeat until you find the rate where NPV equals zero.
Because the process is iterative, it can be time-consuming by hand. Financial calculators and spreadsheet tools like Excel simplify this process. In Excel, you use the =IRR(values) function for evenly spaced cash flows. For irregular timing, =XIRR(values, dates) is recommended.
Remember, IRR calculations require at least one negative and one positive cash flow, and cash flows should be evenly spaced unless using XIRR. With these steps, you can confidently compute IRR for a variety of investment projects.
Practical IRR Calculation Methods for 2025
Mastering practical IRR calculation techniques is crucial for making sound investment decisions in 2025. Whether you are a finance professional or an investor, understanding how to calculate IRR by hand, with financial calculators, or using spreadsheets gives you the confidence to analyze real opportunities. Let’s break down each method and highlight best practices.
Calculating IRR by Hand
Calculating IRR by hand is the most fundamental approach, though it can be time-consuming for anything beyond simple investments. The IRR is the discount rate that sets the net present value of all cash flows to zero. To start, list out all projected cash flows, including the initial investment as a negative value and future inflows as positives.
The process involves:
- Guessing an IRR rate.
- Discounting each cash flow to its present value using the guessed rate.
- Summing the present values.
- Adjusting the rate up or down and repeating the process until the sum equals zero.
Example Calculation: Suppose you invest $100,000 today and expect $30,000 annually for five years. You start by guessing an IRR of 10 percent, discount each inflow, sum them, and check if the total equals your initial outflow. If not, try a higher or lower rate.
This trial-and-error process can be tedious, especially as the number of cash flows increases. For complex cash flow patterns, manual IRR calculation quickly becomes impractical. However, understanding this method is valuable for grasping how IRR works behind the scenes and appreciating the time value of money.
Using Financial Calculators and Software
Financial calculators have streamlined IRR calculations, making them a staple in the finance and real estate sectors. Popular models like the HP 10bii or Texas Instruments BA II Plus feature dedicated IRR functions. These devices allow users to input a series of cash flows, including the initial investment and subsequent inflows or outflows.
Step-by-Step on a Financial Calculator:
- Enter the initial investment as a negative value.
- Input each subsequent cash flow in order.
- Use the IRR or IRR/YR button to compute the rate.
The calculator automatically applies the iterative process, pinpointing the IRR far quicker than manual calculations. This method is highly accurate, reduces human error, and can handle multiple uneven cash flows with ease.
Financial calculators are particularly useful when analyzing real estate deals, business investments, or equipment purchases where cash flows are predictable and spaced evenly. Compared to manual methods, using a calculator saves significant time and ensures accuracy, making it a preferred tool for professionals who frequently assess IRR as part of their workflow.
Calculating IRR in Excel and Other Spreadsheets
Excel and similar spreadsheet tools have revolutionized IRR analysis by making it accessible and efficient for any user. The core IRR function in Excel, =IRR(values, [guess]), allows you to calculate IRR for a series of evenly spaced cash flows. Enter your cash flows in a column, select the range, and apply the IRR formula. Excel will return the IRR as a percentage, using a default guess of 10 percent if none is provided.
For investments with irregular timing, use the XIRR function: =XIRR(values, dates). This is essential for real-world scenarios where cash flows don't always occur at consistent intervals. XIRR ensures a more precise annualized return by factoring in exact dates.
Example Table:
| Year | Cash Flow |
|---|---|
| 0 | -$100,000 |
| 1 | $30,000 |
| 2 | $30,000 |
| 3 | $30,000 |
| 4 | $30,000 |
| 5 | $30,000 |
Enter these in Excel, use =IRR(A2:A7), and you will instantly have your IRR.
For practical case studies and business ventures, Real-Life Examples of IRR Calculations demonstrate how spreadsheet tools are used to solve real investment challenges.
Excel iterates up to 20 times to find the IRR, and if it cannot, it returns an error. Always ensure you include at least one negative and one positive cash flow, and use XIRR for any uneven cash flow schedules.
Common IRR Calculation Mistakes and How to Avoid Them
Despite the power of modern tools, errors in IRR calculation are common. One frequent mistake is using the standard IRR function for unevenly spaced cash flows, which can distort results. In such cases, always opt for XIRR to reflect true annualized returns.
Another mistake is omitting the initial investment or forgetting to include all cash flows. This can lead to misleading IRR figures and poor investment decisions. Always double-check that your cash flow series is complete and accurate.
Misinterpreting negative IRR results is another pitfall. Negative IRR typically signals that the investment is losing value over time, so investigate further before proceeding. Relying solely on default guesses in spreadsheets or calculators can produce errors if cash flows are unusual.
Finally, be cautious of projects with multiple sign changes in cash flows, as this can result in multiple IRRs. In these scenarios, review the cash flow pattern, consider alternative metrics, and use tools that highlight potential calculation issues. By being aware of these common mistakes, you can ensure your IRR analysis remains robust and reliable.
Applying IRR: Real-World Scenarios and Examples
Unlocking the full potential of irr requires understanding how this metric drives real-world decisions. Across industries, irr is more than just a number—it serves as a strategic tool for evaluating investments, measuring performance, and ranking opportunities. Let's explore how irr is applied by businesses, private equity managers, and investors choosing between competing projects.

How Businesses Use IRR for Decision-Making
For businesses, irr is essential in capital budgeting and project selection. Decision-makers rely on irr to compare various investment options, such as expanding production lines, purchasing equipment, or launching new products. By calculating irr, companies determine whether a project is likely to generate sufficient returns over its lifetime.
A common approach involves setting a "hurdle rate"—the minimum irr required for an investment to be considered. If a project's irr exceeds this threshold, it moves forward. Otherwise, resources are directed elsewhere. For example, a manufacturer might choose between upgrading machinery or developing a new product, using irr to identify which option promises a higher return.
Corporate finance teams also use irr to prioritize projects when capital is limited. This ensures that funds are allocated to the most profitable initiatives. In mergers and acquisitions, irr helps evaluate whether the expected returns justify the purchase price.
It's important to analyze irr alongside other metrics. For instance, a project with a high irr but low total profit may not be as attractive as one with a slightly lower irr and greater overall value. To learn more about how capital expenditure decisions are evaluated in practice, see Understanding capital expenditure.
By integrating irr into their investment processes, businesses can make more informed, data-driven decisions that align with long-term growth objectives.
IRR in Private Equity, Venture Capital, and Real Estate
In private equity and venture capital, irr is the gold standard for assessing fund performance. Limited partners use irr to compare managers and track results over multiple years. For example, a private equity fund reporting an 18% irr over seven years indicates strong capital growth and effective management.
Real estate investors also depend on irr to evaluate property acquisitions and development projects. Consider a scenario where an investor puts $1 million into a commercial property and receives $3 million in returns after five years. The irr, in this case, would be approximately 24.6%, reflecting both the timing and magnitude of the cash flows.
Venture capitalists use irr to analyze various exit scenarios for their portfolio companies. By modeling irr outcomes based on potential acquisition or IPO timelines, they can assess which startups offer the best risk-adjusted returns.
A key advantage of irr in these sectors is its ability to account for the timing of cash inflows and outflows. This is especially valuable when returns are distributed unevenly over a project's life. Many commercial real estate proformas prominently display irr alongside other metrics, as this helps investors compare opportunities on a consistent basis.
However, irr should always be considered alongside risk, market conditions, and alternative metrics to ensure well-rounded investment decisions.
Comparing Investment Opportunities Using IRR
When faced with multiple investment choices, irr becomes a vital screening tool. Investors often rank projects by irr to identify which ones offer the highest potential yield. For instance, if Project A has an irr of 12% and Project B offers 9%, Project A would generally be preferred—provided the risk profiles are similar.
Yet, relying solely on irr can be misleading. The metric does not account for the size of the investment or total profit generated. For example, a small project with a 100% irr might yield only $100, while a larger initiative with a 10% irr could deliver $100,000. This highlights the importance of considering irr in tandem with net present value (NPV) and equity multiples.
Here's a simple comparison table:
| Investment | IRR | Total Profit | NPV |
|---|---|---|---|
| Project A | 10% | $100,000 | $30,000 |
| Project B | 100% | $100 | $20 |
In real estate syndications, irr is frequently advertised alongside these complementary metrics, helping investors make balanced decisions.
Ultimately, combining irr with other financial indicators ensures a more robust analysis and reduces the risk of overlooking crucial factors in the investment process.
Key IRR Limitations and How to Address Them
Understanding the limitations of irr is vital for making sound investment decisions. While irr is a powerful metric, it is not without flaws. Recognizing where it falls short can help you avoid costly mistakes and make more informed choices.
Limitations of IRR
The irr metric, though widely used, has several notable weaknesses:
- Ignores investment scale: A project with a high irr might deliver less profit than one with a lower irr but larger cash flows. For example, a small investment with a 50 percent irr could yield less total profit than a larger project with a 10 percent irr.
- Multiple IRRs: If cash flows change direction more than once, the irr calculation can produce more than one solution. This situation can confuse decision-makers, especially in projects with complex cash flow patterns.
- Unrealistic reinvestment assumption: The traditional irr model assumes interim cash flows are reinvested at the same irr rate. In reality, reinvestment rates may differ, leading to overestimated returns.
- Ignores external factors: irr does not account for inflation, market shifts, or changes in the cost of capital. Relying on irr alone can mask underlying risks.
- Timing distortions: The timing of cash flows can skew irr results, potentially making a project look more attractive than it really is.
Statistic: According to PropertyMetrics, multiple irr values can occur as dictated by Descartes' rule of signs. This highlights the importance of understanding cash flow structures before relying on irr for investment analysis.
Addressing IRR’s Shortcomings
To make irr more reliable, investors and analysts often supplement it with other tools and adjusted metrics:
- Modified Internal Rate of Return (MIRR): MIRR addresses the reinvestment rate issue by assuming reinvestment at a more realistic rate, such as the firm's cost of capital.
- Pair with NPV: Using irr alongside Net Present Value provides a fuller picture, revealing both the efficiency and the absolute value of an investment.
- Consider equity multiple and payback period: These metrics highlight total return and liquidity, balancing irr's focus on rate of return.
- Adjust for project size and risk: Always compare irr values in the context of project scale and risk profile. For a deeper understanding of risk-adjusted returns, see risk-weighted assets in finance.
- Use XIRR for irregular cash flows: XIRR in spreadsheets allows for more accurate irr calculations when cash flows are not evenly spaced.
- Explore alternatives: The Average Internal Rate of Return for Risky Projects introduces AIRR, which can provide a more robust measure for evaluating investments with significant risk.
Tip: Always analyze the cash flow pattern, not just the irr percentage, to ensure your investment evaluation is grounded in reality.
Common Misinterpretations and IRR Myths
Many investors misunderstand irr, leading to poor decisions. Here are common myths to avoid:
- Myth: irr always shows true annual return. In fact, irr measures the return on unrecovered capital, not just the original investment.
- Misinterpretation: Higher irr always means a better investment. A project may have a high irr due to early large inflows, but deliver less total profit than a lower-irr, larger-scale project.
- Assumption: irr is the only metric needed. Relying solely on irr ignores cash flow timing, risk, and overall profitability.
For example, a deal with a quick early payout can inflate irr, but if subsequent returns are small, the overall benefit may disappoint. Always use irr in combination with other financial metrics to guide your investment choices.
Advanced IRR Strategies and Best Practices for 2025
Staying ahead in 2025 means taking your irr analysis beyond the basics. Advanced irr strategies empower investors and decision-makers to maximize returns, manage risk, and make smarter choices in complex environments. Let us explore the best practices for using irr to its full potential in today’s fast-evolving financial landscape.
Setting and Evaluating Hurdle Rates
A hurdle rate is the minimum acceptable return on an investment before approval. It acts as a benchmark, ensuring resources are allocated to projects that meet or exceed a company’s required rate of return. Setting the right hurdle rate is crucial for sound irr analysis.
Companies typically determine hurdle rates using the weighted average cost of capital or by assessing opportunity costs. For example, a manufacturer might set a 12 percent hurdle rate for new projects, ensuring only those with an irr above this threshold proceed.
Tips for setting effective hurdle rates:
- Align hurdle rates with market conditions and sector risk
- Adjust for capital costs, inflation, and anticipated volatility
- Regularly review and update hurdle rates as economic factors shift
Most corporations maintain hurdle rates between 8 percent and 15 percent, depending on industry and risk profile. By comparing irr against a well-chosen hurdle rate, businesses can prioritize investments with the greatest potential for value creation.
IRR in Portfolio and Fund Performance Analysis
In private equity and venture capital, irr is the gold standard for measuring fund performance across time. Limited partners (LPs) rely on irr to compare managers, assess strategies, and evaluate historic returns. A fund posting an 18 percent irr over a decade stands out against one with a 14 percent irr, assuming similar risk levels.
However, irr is sensitive to cash flow timing. Quick returns early in a fund’s life can inflate irr, even if total profits are modest. That is why it is best practice to review both gross and net irr figures—net irr provides a more accurate picture after fees and expenses.
For government or public sector investments, empirical studies, such as those on internal rates of return for public R&D, highlight how irr helps assess the societal and financial impacts of large-scale projects. This makes irr invaluable for evaluating both private and public portfolios.
Using IRR with Other Financial Metrics
Relying solely on irr can be misleading. Savvy investors combine irr with other metrics for a complete perspective. Here is how irr stacks up against key alternatives:
| Metric | What It Shows | Strengths | Weaknesses |
|---|---|---|---|
| IRR | Annualized return (%) | Accounts for time value of money | Ignores project scale |
| NPV | Absolute value ($) | Shows total value created | Sensitive to discount rate |
| Payback Period | Time to recover investment | Highlights liquidity, risk | Ignores returns after payback |
| Equity Multiple | Total return ($/$ invested) | Measures total profit | Ignores timing of returns |
For example, a project with a 15 percent irr, a positive NPV, and a 2.0x equity multiple is likely a strong candidate. Incorporating metrics like net interest margin, as explained in net interest margin explained, can further enhance your irr-based investment analysis.
Combining these metrics helps you see not just how efficiently capital is used, but also the absolute and relative gains over time.
Navigating IRR in the Era of Uncertainty (2025 Outlook)
Financial markets in 2025 face volatility, shifting interest rates, and rapid technological change. Adapting irr analysis to these conditions is essential for accurate forecasting and risk management.
Stress-testing irr assumptions under different scenarios can reveal vulnerabilities. For instance, higher inflation or sudden rate hikes may reduce future cash flows, lowering irr. Scenario planning allows you to prepare for best and worst-case outcomes.
Integrating advanced software and AI tools enables more precise irr projections. These tools quickly process complex, irregular cash flows and model market shifts, helping you make data-driven decisions. Remember, irr is a guide, not a guarantee—always complement it with real-world judgment and continuous monitoring.
Expert Tips for Maximizing IRR in 2025
To make the most of irr in 2025, consider these actionable strategies:
- Structure cash flows to maximize early payouts, boosting irr
- Reinvest interim returns in high-yield opportunities
- Monitor project performance and adjust tactics as conditions evolve
- Use scenario analysis to anticipate and mitigate risks to irr
- Benchmark against industry averages and update your irr models regularly
By consistently applying these best practices, your irr analysis will remain robust, adaptable, and aligned with your investment objectives. Mastering these advanced irr strategies ensures your decisions are informed, competitive, and future-ready.
Now that you’ve explored the essentials of IRR and how it shapes smarter investment decisions, imagine having the power to see not just the numbers but the stories behind them. Historic Financial News is building a platform where you can dive into interactive charts, AI-powered insights, and original news—giving you historical context for every metric you analyze. If you’re ready to master IRR and spot patterns that others miss, I invite you to Join Our Beta and help us bring financial history to life for investors like you.