
Credit Spread: Historical Analysis and Market Insights
Understanding the behavior of credit spreads throughout market history provides invaluable insights into investor sentiment, economic conditions, and systemic risk. This fundamental metric has served as both a predictor and a reflection of major financial events, from the Great Depression to the 2008 financial crisis and beyond. By examining credit spread patterns across different economic cycles, we can better understand how markets price risk and what these signals tell us about future market movements. For anyone studying financial history or analyzing current market conditions, mastering this concept is essential to developing a comprehensive understanding of fixed income markets and broader economic trends.
What Defines a Credit Spread
A credit spread represents the difference in yield between two debt instruments of similar maturity but different credit quality. Most commonly, this metric compares corporate bonds to government securities, which are considered virtually risk-free. The spread compensates investors for taking on additional default risk when purchasing debt from private issuers rather than sovereign borrowers.
The fundamental calculation involves subtracting the yield on a benchmark government bond from the yield on a corporate or municipal bond with the same maturity date. When spreads widen, it indicates investors demand higher compensation for perceived risk. Conversely, narrowing spreads suggest growing confidence in borrower creditworthiness or increased appetite for risk among market participants.

Key Components of Credit Spread Analysis
Several factors determine the size and movement of credit spreads in financial markets:
- Credit rating of the issuer determines baseline risk assessment
- Economic conditions influence default probability expectations
- Liquidity considerations affect how easily bonds can be traded
- Supply and demand dynamics in both corporate and government debt markets
- Time to maturity impacts sensitivity to credit events
Market participants use credit spreads as an analytical technique to compare the relative value of different fixed income securities. This comparison helps portfolio managers make informed decisions about where to allocate capital based on their risk tolerance and return objectives.
Historical Patterns in Credit Spread Movements
Throughout financial history, credit spreads have exhibited predictable patterns during different phases of economic cycles. During periods of economic expansion, spreads typically narrow as corporate profits improve and default rates decline. Investors become more confident in the ability of companies to meet their debt obligations, reducing the premium they demand.
The inverse relationship becomes apparent during recessions and financial crises. Historical data shows that credit spreads can widen dramatically when economic uncertainty increases. During the 2008 financial crisis, for instance, investment-grade corporate bond spreads exceeded 600 basis points over Treasuries, compared to typical levels of 100-150 basis points during stable periods.
Notable Historical Episodes
| Period | Event | Spread Behavior | Duration |
|---|---|---|---|
| 1929-1933 | Great Depression | Extreme widening (1000+ bps) | 4 years |
| 1987 | Black Monday | Brief spike, quick recovery | 3-6 months |
| 1998 | LTCM Crisis | Sharp widening (300+ bps) | 6 months |
| 2001-2002 | Dot-com Bust | Gradual widening (250 bps) | 18 months |
| 2008-2009 | Financial Crisis | Severe widening (600+ bps) | 12 months |
| 2020 | COVID-19 Pandemic | Rapid spike, policy-driven recovery | 3 months |
These historical examples demonstrate how credit spreads function as a real-time barometer of market stress. The speed and magnitude of spread movements often correlate with the severity of economic disruptions and the effectiveness of policy responses.
Credit Spreads Across Different Bond Categories
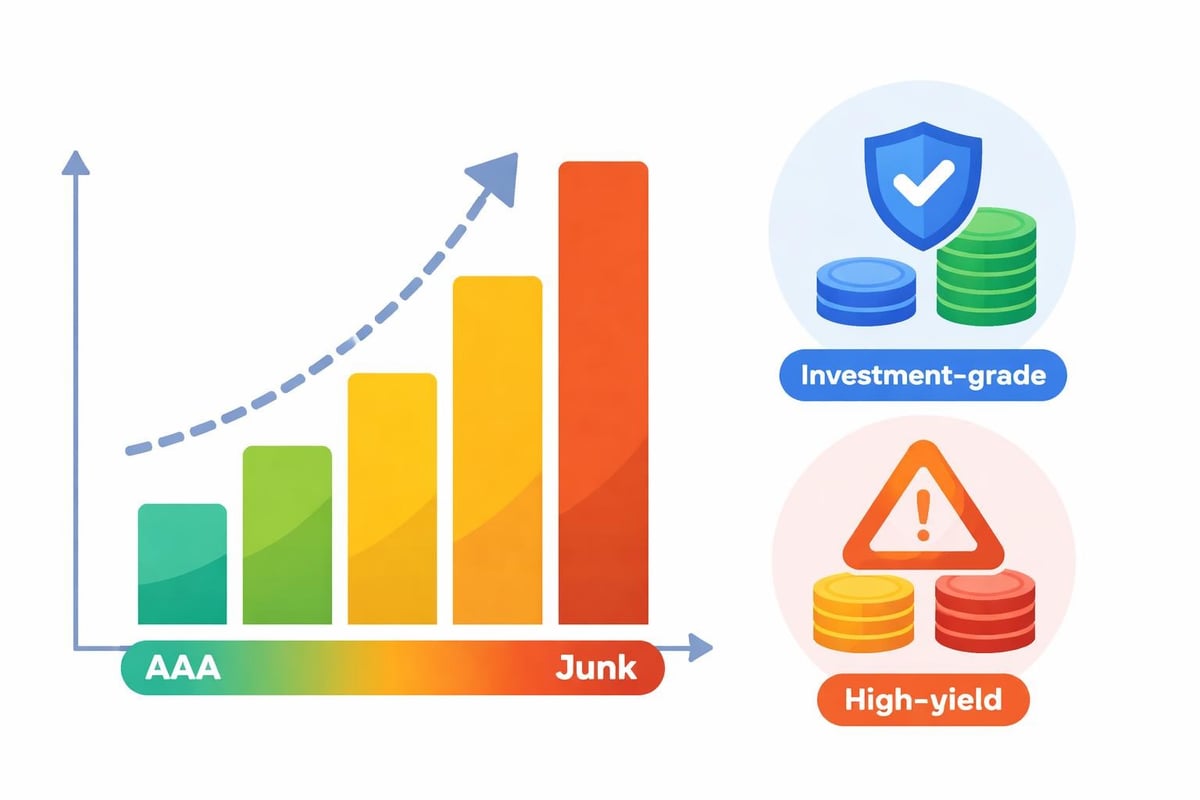
Not all credit spreads behave identically. The fixed income market segments itself across multiple dimensions, and understanding these distinctions helps analysts interpret spread movements more accurately. Investment-grade corporate bonds typically maintain tighter spreads than high-yield securities, reflecting their lower default probability.
Investment-grade bonds generally trade at spreads ranging from 50 to 200 basis points over comparable Treasuries during normal market conditions. These securities come from established companies with strong balance sheets and consistent cash flow generation. Their spread movements tend to be more gradual and less volatile than lower-rated debt.
High-yield or "junk" bonds exhibit much wider spreads, often ranging from 300 to 800 basis points in stable environments. During stressed periods, these spreads can exceed 1,000 basis points as investors flee to quality. The additional return for risk in this segment reflects both higher default probability and lower recovery rates in the event of bankruptcy.
Sector-Specific Spread Behavior
Different industries demonstrate unique spread characteristics based on their business models and economic sensitivities:
- Financial sector spreads correlate closely with banking system health and regulatory changes
- Energy sector spreads respond to commodity price fluctuations and geopolitical events
- Utility spreads remain relatively stable due to regulated revenue streams
- Technology spreads reflect rapid growth potential balanced against competitive risks
- Industrial spreads move with manufacturing cycles and global trade patterns
Historical analysis reveals that sector rotation in credit markets often precedes similar movements in equity markets. Savvy investors study these patterns to identify emerging opportunities and risks before they become apparent in stock prices.
The Role of Credit Spreads in Risk Assessment
Credit spreads serve multiple functions in modern portfolio management and risk analysis. Beyond simply indicating the price of credit risk, they provide forward-looking signals about economic conditions and market sentiment. Many analysts consider widening spreads an early warning sign of potential economic slowdowns.
The relationship between credit spreads and default risk reflects investor expectations about future corporate health. When spreads widen substantially, it suggests the market anticipates higher default rates ahead. This expectation may stem from deteriorating economic fundamentals, tightening credit conditions, or sector-specific challenges.
Risk managers incorporate credit spread analysis into their stress testing frameworks. By examining how spreads behaved during previous crises, they can estimate potential losses in various scenarios. This historical perspective proves invaluable when assessing portfolio resilience and determining appropriate hedging strategies.
Spread Duration and Volatility
The sensitivity of credit spreads to market changes varies considerably:
- Short-duration bonds experience less price impact from spread movements
- Long-duration securities suffer greater price volatility when spreads widen
- Callable bonds introduce additional complexity through embedded options
- Convertible bonds blend equity and credit risk characteristics
Understanding these dynamics helps investors construct portfolios aligned with their risk tolerance and return objectives. Historical data shows that spread volatility itself tends to cluster, with calm periods punctuated by sudden spikes during market dislocations.
Credit Spreads in Options Trading Strategies
While most discussions focus on bond markets, the term credit spread also applies to specific options trading strategies. In this context, credit spread strategies involve simultaneously selling and buying options at different strike prices to generate premium income while limiting risk exposure.
These options strategies differ fundamentally from bond spread analysis but share a common principle: balancing risk and reward through deliberate position construction. The terminology reflects the fact that traders receive a net credit when establishing the position, unlike debit spreads where they pay to enter the trade.
| Strategy Type | Structure | Market View | Maximum Profit |
|---|---|---|---|
| Bull Put Spread | Sell put, buy lower put | Moderately bullish | Net premium received |
| Bear Call Spread | Sell call, buy higher call | Moderately bearish | Net premium received |
| Iron Condor | Combined put and call spreads | Range-bound | Net premium received |
Understanding both interpretations of credit spread enriches an investor's analytical toolkit and demonstrates the interconnected nature of modern financial markets.
Economic Indicators and Credit Spread Correlation
Credit spreads maintain strong relationships with various economic indicators, making them useful predictive tools. The correlation between spreads and GDP growth rates has proven remarkably consistent over decades. Widening spreads typically precede economic slowdowns by several months, while narrowing spreads accompany recoveries.
Employment data also correlates with spread movements. Rising unemployment generally coincides with wider spreads as default risk increases across corporate sectors. The interest coverage ratio for the aggregate corporate sector shows similar patterns, declining as spreads widen and improving as they narrow.

Inflation expectations influence credit spreads through multiple channels. Higher inflation can erode the real value of fixed coupon payments, but it may also support corporate revenues and pricing power. Historical analysis reveals that moderate inflation often coincides with tight spreads, while both deflation and hyperinflation scenarios produce spread widening.
Central Bank Policy Impact
Monetary policy decisions profoundly affect credit spread dynamics:
- Interest rate cuts typically compress spreads by improving borrower debt service capacity
- Quantitative easing programs directly reduce spreads through asset purchases
- Forward guidance shapes market expectations and spread trajectories
- Emergency lending facilities provide backstops that narrow spreads during crises
- Regulatory changes alter bank capital requirements and credit availability
The unprecedented quantitative easing programs implemented after 2008 demonstrated how aggressive central bank intervention can override fundamental credit concerns. Spreads compressed even as underlying economic conditions remained weak, illustrating the powerful influence of policy on market pricing.
Analyzing Historical Spread Data for Investment Decisions
Successful investors develop systematic approaches to interpreting credit spread signals. Rather than reacting to every spread fluctuation, they establish frameworks for distinguishing noise from meaningful signals. Historical context proves essential in this evaluation process.
Comparing current spread levels to historical percentiles helps investors assess whether credit markets appear overvalued or undervalued. When spreads fall below the 10th percentile of their historical range, it suggests limited additional upside and increased downside risk. Conversely, spreads above the 90th percentile may indicate excessive pessimism and potential opportunity.
Spread velocity matters as much as absolute levels. Rapid spread widening often creates overshooting as panic selling drives prices beyond levels justified by fundamentals. These dislocations can create attractive entry points for patient investors with sufficient capital and risk tolerance to weather continued volatility.
Building a Historical Analysis Framework
Effective credit spread analysis incorporates multiple timeframes and contexts:
- Short-term movements (days to weeks) reflect technical factors and sentiment shifts
- Medium-term trends (months to quarters) align with economic cycle progression
- Long-term patterns (years to decades) reveal structural market changes
- Cross-market comparisons identify relative value opportunities across regions and sectors
Students of market history understand that while past patterns don't guarantee future results, they provide valuable context for evaluating current conditions. The patterns visible in historical market data help investors develop more sophisticated risk assessment capabilities.
Credit Spread Curves and Term Structure
Credit spreads vary not only across different issuers but also across maturity spectrums. The credit spread curve plots the relationship between spread levels and time to maturity, revealing important information about market expectations. Typically, longer-dated bonds carry wider spreads to compensate investors for extended exposure to default risk.
However, this relationship can invert during periods of acute stress. When near-term default concerns intensify, short-maturity spreads may exceed long-maturity spreads. Such inversions have historically preceded major credit events and economic downturns. The shape of the credit spread curve therefore provides diagnostic information about market perceptions of risk timing.
Analyzing how spread curves shift during different market regimes enhances understanding of credit market dynamics. Parallel shifts indicate broad changes in risk appetite, while curve steepening or flattening reveals more nuanced expectations about the path of credit conditions.
Comparative Analysis Across Issuers
Credit spread analysis gains depth through systematic comparison:
- Peer group analysis identifies outliers deserving further investigation
- Historical spread ranges establish normal versus stressed level boundaries
- Spread-to-rating relationships highlight potential rating changes
- Cross-currency spreads reveal regional risk perceptions
These comparative techniques transform raw spread data into actionable investment insights. Historical records show that relative spread movements often predict future absolute price changes, making comparative analysis a powerful tool for active portfolio management.
The Information Content of Credit Spreads
Financial economists have extensively studied whether credit spreads accurately predict future defaults and economic conditions. Research generally supports the view that spreads contain valuable forward-looking information, though they also embed risk premiums that may exceed expected loss rates.
The decomposition of credit spreads into expected default losses and risk premiums helps investors understand market pricing. During calm periods, risk premiums compress as investors accept lower compensation for bearing credit risk. Crisis periods see risk premiums explode as liquidity evaporates and uncertainty surges.
Historical examination reveals that credit spreads have successfully signaled every major recession since 1960, though they have also generated some false signals. The predictive power improves when spread analysis combines with other indicators like the yield curve slope and equity market volatility measures. This multi-factor approach reduces false positives while maintaining sensitivity to genuine economic deterioration.
Understanding credit spread behavior through historical analysis provides essential context for navigating today's complex fixed income markets. By examining how spreads have responded to various economic conditions, policy interventions, and market stresses over decades, investors gain perspective that enhances their decision-making capabilities. The patterns visible in historical credit spread data reveal timeless principles about risk pricing while highlighting how structural market changes affect contemporary trading dynamics. Historic Financial News empowers investors, students, and market analysts to explore these patterns through interactive historical charts and AI-powered analysis, helping you understand the stories behind market movements and make more informed decisions based on lessons from the past.