
Convexity in Finance: A Historical Market Perspective
Understanding convexity represents one of the most critical yet often misunderstood concepts in fixed-income investing and portfolio management. This mathematical property describes how bond prices change in response to interest rate movements, revealing a curved relationship rather than a linear one. For investors analyzing historical market data, grasping convexity provides essential context for understanding why certain portfolios performed differently during periods of interest rate volatility. The concept extends beyond simple price sensitivity, offering a second-order measure that captures the acceleration of price changes as yields fluctuate.
The Mathematical Foundation of Convexity
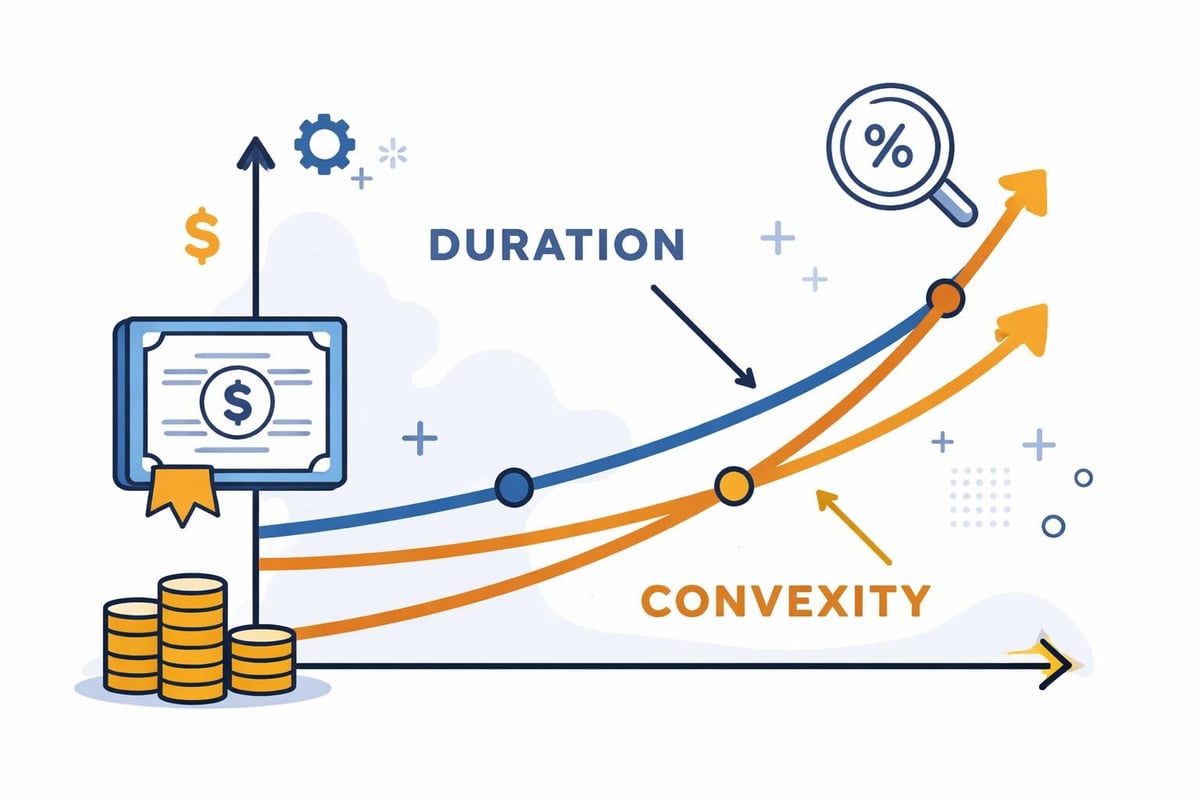
Convexity in finance measures the curvature in the relationship between bond prices and yields. While duration provides a first-order approximation of price sensitivity to yield changes, convexity captures the rate at which duration itself changes as yields move. This second derivative becomes particularly important during significant market movements.
Calculating Convexity in Practice
The mathematical formula for convexity involves summing the present values of all cash flows, weighted by the time squared until receipt. Portfolio managers use this calculation to:
- Estimate price changes beyond what duration alone predicts
- Compare bonds with similar durations but different cash flow structures
- Construct immunized portfolios that protect against interest rate shifts
- Identify pricing inefficiencies in the fixed-income market
For investors examining historical bond market data, convexity calculations reveal why certain securities outperformed during volatile periods. A bond with higher convexity experiences smaller price declines when yields rise and larger price gains when yields fall compared to a bond with lower convexity but identical duration.
Historical Market Events Through the Lens of Convexity
Studying past market crises reveals how convexity played a crucial role in portfolio performance. During the 1994 bond market crash, many investors learned painful lessons about negative convexity in mortgage-backed securities. When the Federal Reserve unexpectedly raised interest rates, homeowners stopped refinancing, extending the duration of these securities precisely when investors needed shorter durations.
The 2008 Financial Crisis and Convexity Risk
The financial crisis of 2008 demonstrated convexity's importance across multiple asset classes. Treasury bonds with positive convexity provided valuable protection as investors fled to safety. Meanwhile, certain structured products exhibited negative convexity characteristics that amplified losses during the downturn.
Key observations from historical analysis include:
- Flight to Quality: Long-duration Treasury bonds benefited from both declining yields and positive convexity
- Mortgage Securities Challenges: Prepayment risk created negative convexity exactly when markets became volatile
- Corporate Bond Spreads: Credit spreads widened dramatically, but convexity helped higher-quality issues outperform
- Callable Bond Performance: Securities with embedded options showed their convexity limitations during rapid yield changes
Understanding these historical patterns helps modern investors recognize similar setups in current markets. The relationship between asset-backed securities and convexity remains particularly relevant when analyzing structured finance products.
Positive Versus Negative Convexity
Not all bonds exhibit the same convexity characteristics. Standard non-callable bonds display positive convexity, meaning their prices become less sensitive to yield increases and more sensitive to yield decreases. This asymmetric behavior benefits investors during volatile markets.
| Bond Type | Convexity Characteristic | Historical Example |
|---|---|---|
| Treasury Bonds | Positive | Outperformed during 1987 crash |
| Callable Corporates | Negative when near call price | Underperformed in 1993 rally |
| Mortgage-Backed Securities | Negative due to prepayment | Struggled in 1994 and 2003 |
| Zero-Coupon Bonds | High Positive | Amplified gains in 2008 flight to quality |
The Callable Bond Dilemma
Callable bonds present a unique convexity challenge that has repeated throughout market history. When interest rates fall and bond prices rise toward the call price, the issuer gains the incentive to refinance. This ceiling on price appreciation creates negative convexity, limiting investor upside.
Historical data from the 1990s shows how callable corporate bonds underperformed non-callable equivalents during the declining rate environment. Investors who understood convexity positioned their portfolios accordingly, avoiding securities with embedded call options when rates appeared likely to fall. The concept of face value becomes particularly important when analyzing callable bond behavior near redemption prices.
Duration and Convexity Working Together
While duration measures the slope of the price-yield curve at a specific point, convexity measures how that slope changes. Together, these metrics provide a more complete picture of interest rate risk than either alone. Basis points represent the standard unit for measuring yield changes in these calculations.
Building a Historical Analysis Framework
Investors analyzing past market periods should consider both metrics simultaneously:
- Duration tells you the expected percentage price change for a small yield movement
- Convexity adjusts that estimate for larger yield changes
- Combined analysis reveals which bonds offered superior risk-adjusted returns during volatile periods
The 1980s bond market provides an excellent case study. During this decade of dramatic interest rate declines, long-duration bonds with high positive convexity delivered exceptional returns. Investors who recognized this opportunity early positioned portfolios to capture both the duration benefit and the convexity bonus as rates fell from historic highs.
Portfolio Immunization and Convexity Matching
Institutional investors often seek to immunize portfolios against interest rate changes by matching duration to their liability horizons. However, duration matching alone proves insufficient without considering convexity. Historical pension fund data demonstrates how portfolios with matched duration but mismatched convexity experienced unexpected shortfalls.
The Barbell Versus Bullet Strategy Debate
Two classic portfolio construction approaches illustrate convexity's practical implications:
Barbell Strategy: Combining short-term and long-term bonds typically produces higher convexity than intermediate bonds with the same duration. Historical performance during the 2013 taper tantrum showed barbell portfolios experiencing smaller losses than bullet portfolios as yields rose sharply.
Bullet Strategy: Concentrating holdings in intermediate maturities offers lower convexity but potentially higher yield. During stable rate environments like 2004-2006, bullet strategies often outperformed due to their yield advantage.
| Strategy | Average Convexity | 2013 Performance | 2008 Performance |
|---|---|---|---|
| Barbell (2/30 year mix) | High | Better downside protection | Enhanced upside capture |
| Bullet (10 year focus) | Moderate | Larger drawdowns | Moderate gains |
| Ladder (even distribution) | Moderate-High | Balanced results | Steady appreciation |
Mathematical Properties and Applications
The formal mathematical definition of convexity extends far beyond finance into pure mathematics and optimization theory. Understanding these broader applications enriches financial analysis by providing additional tools and frameworks.
Convexity in Options Pricing
Options exhibit convexity in their payoff structures, creating asymmetric risk-reward profiles. Historical analysis of option strategies during market crashes reveals how positive convexity in long option positions provided portfolio protection. The 1987 crash demonstrated this dramatically, as investors holding protective puts benefited from accelerating gains as the market fell.
Gamma, the option Greek measuring convexity, becomes particularly valuable during volatile periods. Historical volatility surfaces show how gamma values spike during crises, making convexity even more important for risk management. Understanding convertible bonds requires analyzing both bond convexity and equity option convexity characteristics.
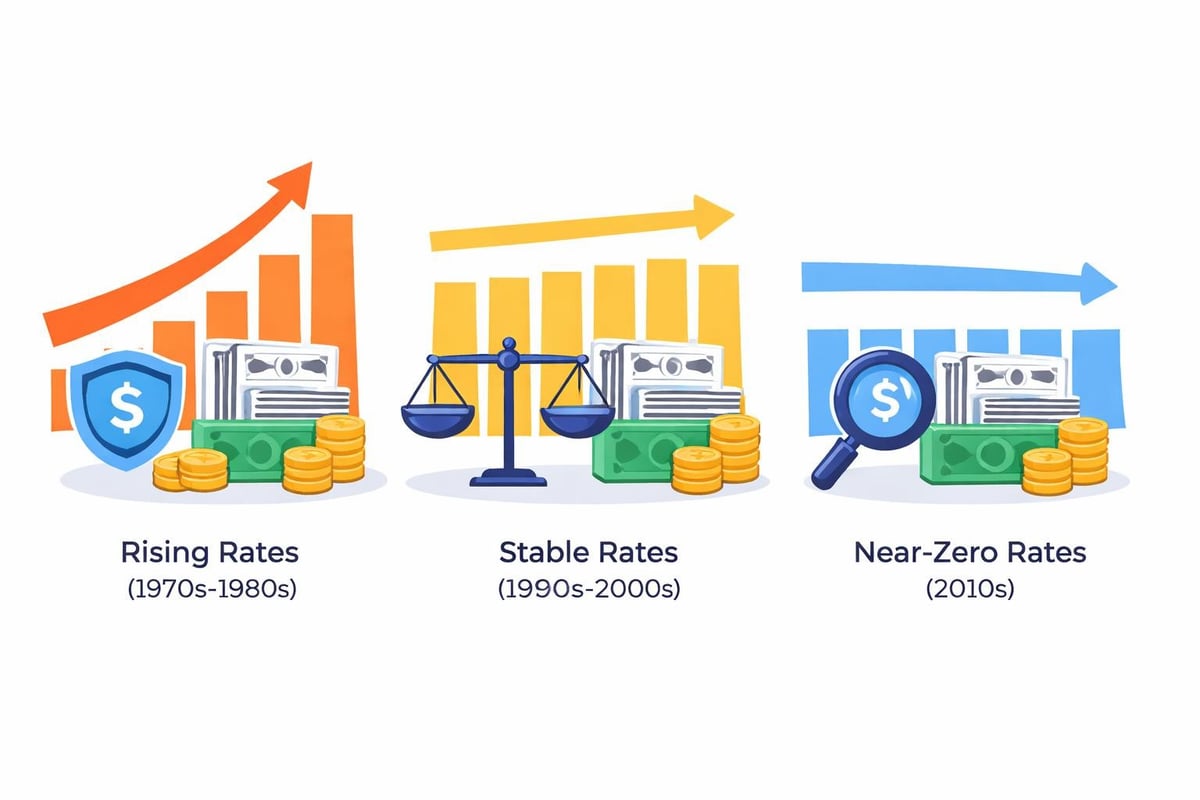
Historical Rate Environments and Convexity Performance
Different interest rate regimes create varying conditions for convexity to add or subtract value. Examining historical cycles reveals patterns that inform current investment decisions.
The Volcker Era (1979-1982)
When Paul Volcker aggressively raised rates to combat inflation, bonds with lower convexity suffered less severe price declines. Shorter-duration bonds naturally possessed less convexity but also less overall interest rate sensitivity. Investors who maintained flexibility by avoiding negative convexity positions preserved more capital during this tumultuous period.
The Great Moderation (1983-2007)
This period of relatively stable interest rates reduced convexity's importance in many portfolios. The gradual decline in rates favored duration over convexity considerations. However, investors who maintained positions in high-convexity securities still benefited during periodic volatility spikes like the 1994 bond crash and 1998 Russian default crisis.
The Zero Interest Rate Era (2009-2015)
With rates near zero, traditional convexity calculations became less meaningful for short-term securities. However, long-duration bonds maintained significant positive convexity, providing protection against deflation fears and supporting prices during European debt crisis episodes. The floating rate market expanded during this period as investors sought alternatives to traditional fixed-rate convexity exposure.
Measuring and Managing Convexity Risk
Quantifying convexity risk requires sophisticated analytical tools and historical data. Modern portfolio managers use scenario analysis to stress-test convexity exposures against historical rate movements.
Key Measurement Approaches
Professional investors employ several methods to assess convexity:
- Effective Convexity: Accounts for embedded options and changing cash flows
- Modified Convexity: Assumes fixed cash flows regardless of yield changes
- Negative Convexity Exposure: Specific measurement of downside asymmetry
- Convexity-Adjusted Duration: Combines both metrics for comprehensive risk assessment
Historical backtesting demonstrates that portfolios with higher convexity generally outperformed during periods of increased volatility. The volatility spike during March 2020 provided a recent example, as Treasury bonds with positive convexity gained value even as credit spreads widened dramatically across corporate bonds.
Sector Variations in Convexity Characteristics
Different fixed-income sectors exhibit distinct convexity profiles that have remained relatively consistent across market cycles. Understanding these sector-specific characteristics helps investors construct more resilient portfolios.
Government Securities
Treasury bonds represent the benchmark for positive convexity in fixed-income markets. Historical data shows these securities consistently delivered convexity benefits during crises. The predictable cash flows and absence of credit risk or embedded options create pure interest rate convexity exposure.
Corporate Bonds
Investment-grade corporate bonds typically display positive convexity similar to Treasuries, though credit spread volatility adds complexity. High-yield bonds show more complex convexity patterns due to their equity-like characteristics during stress periods. The debt-to-equity ratio of issuers influences convexity behavior during credit cycle transitions.
Structured Products
Mortgage-backed securities and collateralized mortgage obligations demonstrate how structural features create negative convexity. Historical prepayment data from housing boom and bust cycles illustrates the challenges these securities pose during volatile rate environments.
Global Fixed-Income Convexity Considerations
International bond markets present additional convexity complexity through currency exposure and varying market structures. Historical analysis of sovereign debt crises reveals how convexity interacts with credit risk and currency risk.
Emerging Market Dynamics
Emerging market bonds often exhibit different convexity characteristics than developed market equivalents. Higher yields create steeper price-yield curves, amplifying both duration and convexity effects. The 1997 Asian financial crisis and subsequent emerging market contagion demonstrated how convexity risk compounds with currency and credit risks.
European Sovereign Debt
The European debt crisis of 2010-2012 showed how peripheral sovereign bonds experienced convexity behavior more similar to corporate bonds than traditional government securities. Greek, Portuguese, and Irish bonds displayed asymmetric price movements as credit spreads dominated pure interest rate convexity.
Advanced Applications for Market Historians
Researchers examining historical market data can leverage convexity analysis to explain portfolio performance during pivotal moments. Several advanced applications deserve attention:
- Attribution Analysis: Separating duration effects from convexity contributions to total return
- Risk Decomposition: Understanding how convexity risk interacted with credit and liquidity risks
- Relative Value Studies: Identifying periods when convexity was mispriced across sectors
- Policy Impact Assessment: Measuring how central bank actions affected convexity across the yield curve
Historical fixed-income databases gain additional analytical power when convexity measures are calculated and tracked alongside traditional metrics. Patterns emerge showing how convexity premiums expand and contract with market volatility cycles.
Practical Lessons from Convexity History
Several enduring lessons emerge from historical convexity analysis. First, positive convexity provides valuable downside protection during crises, often justifying slightly lower yields during stable periods. Second, negative convexity securities require adequate yield compensation to offset their asymmetric risk profiles. Third, convexity effects amplify during high volatility environments, making the metric more valuable precisely when markets become unstable.
Portfolio construction benefits from maintaining awareness of aggregate convexity exposure. Historical data suggests that modest positive convexity across overall fixed-income allocations reduced drawdowns during most market stress periods. However, this protection came at the cost of marginally lower returns during extended stable periods.
The interaction between convexity and other risk factors deserves ongoing attention. Credit risk, liquidity risk, and convexity risk often correlate during crisis periods, creating compounding effects that simple risk models underestimate. The 2008 financial crisis particularly demonstrated how these risks reinforced each other, catching many sophisticated investors unprepared.
Convexity analysis provides essential insights for understanding historical bond market performance and constructing resilient portfolios. By examining how this mathematical property influenced returns during past market cycles, investors gain valuable perspective on managing interest rate risk today. Historic Financial News offers interactive tools and historical market data that help you explore convexity's impact across different eras, empowering you to recognize patterns and apply lessons from the past to your investment decisions.