
Relative Strength Index Guide: Master RSI Strategies in 2026
Unlock the power of technical analysis by mastering the relative strength index, the tool top traders will rely on in 2026. As markets become more complex, understanding the relative strength index gives you a measurable advantage in spotting opportunities and avoiding pitfalls.
This guide demystifies the indicator, offering actionable strategies and the latest insights for smarter trading. You will discover RSI fundamentals, advanced calculation methods, proven strategies, practical tips, and the most common mistakes to avoid.
Are you ready to elevate your trading and master RSI for the future? Start your journey here.
Understanding the Relative Strength Index: Foundations and Evolution
The relative strength index has shaped the way traders analyze markets for decades. To master this indicator, it is vital to understand its origins, mathematical foundation, and how to interpret its signals in practice.
What Is RSI? Definition and Historical Context
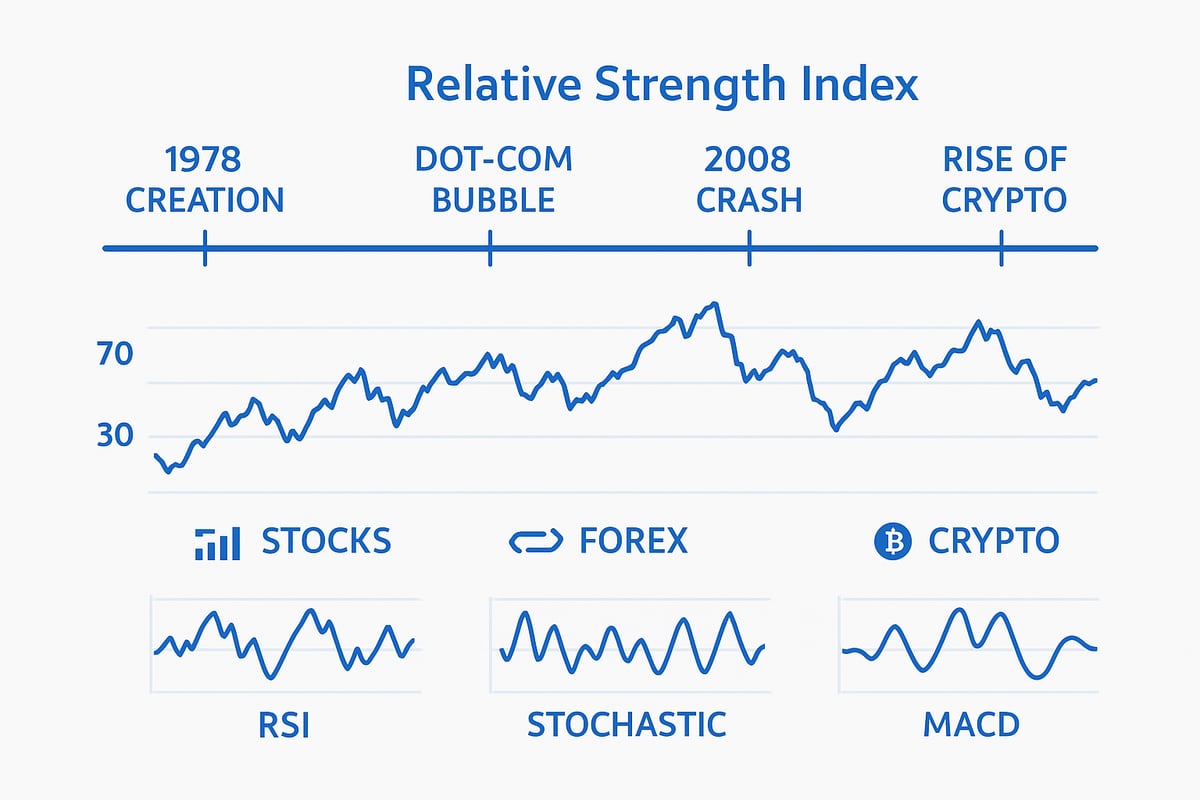
The relative strength index, or RSI, was introduced by J. Welles Wilder Jr. in 1978. It was designed to measure the speed and magnitude of price changes, providing insights into market momentum. RSI quickly gained traction among traders and analysts, becoming a core part of technical analysis.
RSI’s popularity is rooted in its simplicity and reliability. According to Fidelity, the relative strength index is now one of the top three indicators used worldwide. It is regularly cited in major financial publications and relied upon during significant market events. For example, during the dot-com bubble and the 2008 financial crisis, RSI readings helped traders anticipate reversals and manage risk.
Unlike other oscillators such as Stochastic or MACD, RSI focuses solely on price momentum without factoring in volume or trend direction. The table below highlights key differences:
| Indicator | Measures | Typical Range | Primary Use |
|---|---|---|---|
| RSI | Price momentum | 0 to 100 | Overbought/oversold |
| Stochastic | Closing price vs range | 0 to 100 | Trend confirmation |
| MACD | Moving averages | Varies | Trend and momentum |
A crucial strength of the relative strength index is its adaptability. Traders use RSI across stocks, forex, crypto, and commodities, making it a versatile tool. If you are new to technical terms, the Key finance terms glossary can provide helpful definitions as you explore RSI concepts.
How RSI Works: The Mathematics Behind the Indicator
The calculation behind the relative strength index is both elegant and practical. The classic RSI formula is:
RSI = 100 - [100 / (1 + RS)]
RS = Average Gain over N periods / Average Loss over N periods
Most platforms use a 14-day period by default. This window provides a balance between signal sensitivity and noise reduction, but traders often adjust it based on their strategy or asset class. The RSI value always falls between 0 and 100, with readings above 70 considered overbought and below 30 seen as oversold.
Let’s consider a simple example. Suppose a stock has the following closing prices over 14 days. You would first calculate the average gain and average loss, then plug those values into the formula. This process can be done manually for deeper understanding, or automated for efficiency.
Smoothing techniques, like using exponential moving averages, enhance signal accuracy by reducing whipsaws in volatile markets. Understanding the math behind the relative strength index helps prevent misinterpretation, especially when markets are moving rapidly.
Interpreting RSI: Overbought, Oversold, and Divergence
Reading the relative strength index involves more than just watching for high or low values. RSI is considered overbought when it rises above 70 and oversold when it falls below 30. These levels often signal that a price reversal or correction could be approaching.
Divergence is another important concept. When the price moves in the opposite direction of the RSI, it can hint at a potential trend reversal. For instance, during the 2020–2022 market corrections, RSI divergence often preceded major price shifts.
RSI behaves differently in uptrends and downtrends. In strong trends, RSI may remain overbought or oversold for extended periods, producing false signals if used alone. This highlights the importance of context. For best results, combine the relative strength index with trend analysis or other indicators to improve reliability.
Calculating and Customizing RSI for Modern Markets
A precise understanding of how to calculate and adjust the relative strength index can elevate your trading decisions in today’s dynamic markets. By mastering both the math and customization, you unlock the full potential of this versatile indicator.
Step-by-Step RSI Calculation Guide
Calculating the relative strength index starts with gathering a series of closing prices over your chosen period, typically 14 days. First, determine the price changes from one close to the next, then separate gains and losses.
For each period:
- Calculate average gain and average loss.
- Compute the relative strength (RS) by dividing average gain by average loss.
- Plug RS into the RSI formula.
Here’s a simplified code example:
# RSI calculation for a 14-day period
avg_gain = sum(gains) / 14
avg_loss = sum(losses) / 14
rs = avg_gain / avg_loss
rsi = 100 - (100 / (1 + rs))
Most trading platforms automate this process, but manual calculation deepens your understanding of how the relative strength index responds to price moves. For example, if a tech stock in 2025 closes higher 10 out of 14 days, the RSI will reflect strong momentum.
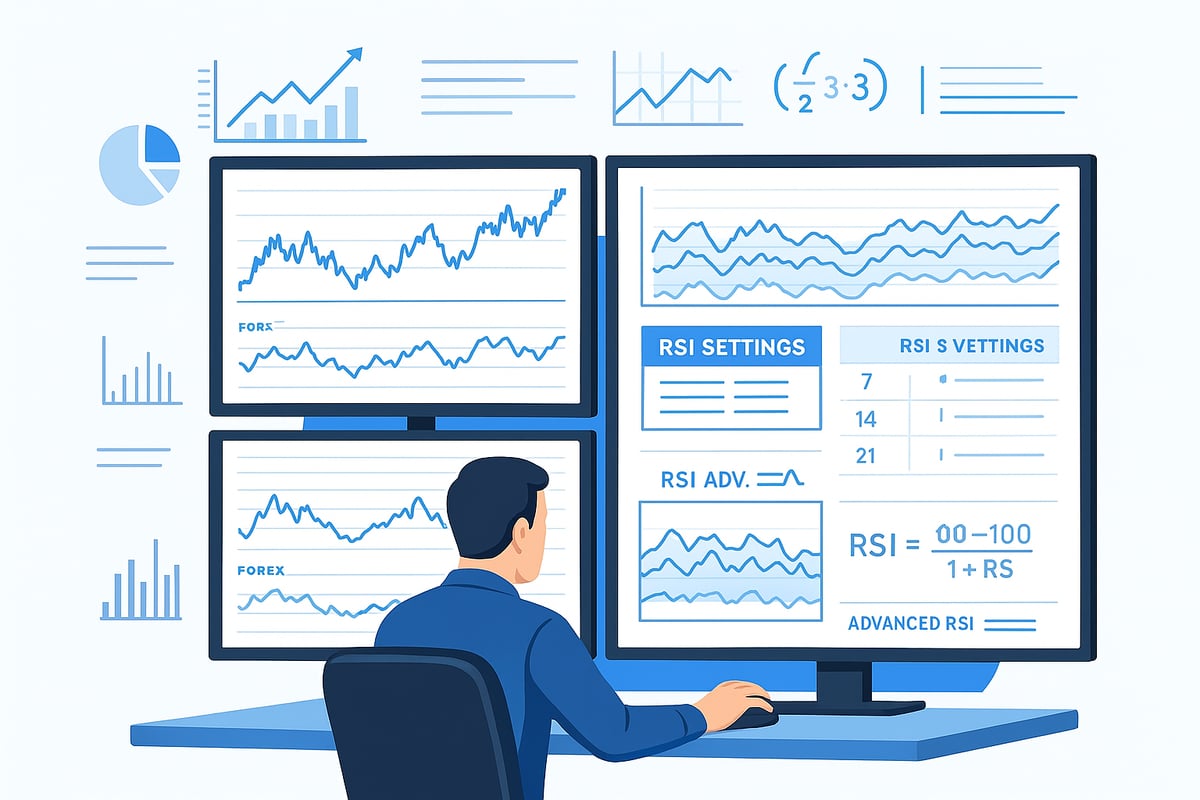
Customizing the period changes the indicator’s behavior. Shorter periods (7 or 9) make the relative strength index more sensitive, capturing quick swings, while longer periods (21 or 28) smooth out noise but may lag. This flexibility allows you to match the relative strength index to your trading timeframe.
Advanced RSI Variants: Cutler’s RSI and More
The classic relative strength index uses Wilder’s formula, which employs exponential smoothing. However, alternative versions like Cutler’s RSI use simple moving averages, reducing calculation bias from missing data, especially in high-frequency or volatile markets.
Here’s a comparison:
| Variant | Smoothing Method | Best Use Case |
|---|---|---|
| Wilder’s RSI | Exponential | Most asset classes, daily charts |
| Cutler’s RSI | Simple Moving Avg | Crypto, penny stocks, data gaps |
| Adaptive RSI | Dynamic smoothing | High-frequency, algorithmic trading |
For assets like cryptocurrencies, where data gaps and volatility are common, Cutler’s RSI can offer more accurate signals. Recent studies, such as the Efficiency of RSI Investment Strategy, show that adapting the relative strength index formula can enhance predictive power across various markets.
Other advanced variants include RSI with exponential smoothing and adaptive formulas that self-adjust to volatility. These tweaks help reduce lag and improve signal quality, especially in fast-moving environments.
RSI Settings for Different Asset Classes
Not all markets behave alike, and the relative strength index performs best when tailored to the asset’s unique characteristics.
For equities, the standard 14-period setting and 70/30 overbought-oversold thresholds work well in most cases. In forex, traders often use shorter periods and tighter bands, such as 80/20, to address rapid price action. Cryptocurrencies require even more customization, given their extreme swings, so many traders opt for 7–10 period RSI and adjust thresholds to 85/15. Commodities, known for their cycles, may benefit from longer periods to filter out noise.
Here’s a quick comparison:
| Asset Class | Typical Period | Overbought/Oversold Levels |
|---|---|---|
| Equities | 14 | 70/30 |
| Forex | 9 or 14 | 80/20 |
| Crypto | 7–10 | 85/15 |
| Commodities | 21 | 70/30 |
Comparing S&P 500 stocks to Bitcoin reveals that a one-size-fits-all approach falls short. Customizing the relative strength index to each asset’s volatility and trading style is essential for reliable signals.
Core RSI Trading Strategies for 2026
Unlocking the full potential of the relative strength index in 2026 requires more than just understanding the basics. To thrive in modern markets, traders must adopt proven strategies, adapt to evolving conditions, and recognize both the strengths and limitations of RSI-based approaches.
Classic RSI Strategies: Overbought/Oversold and Reversal Signals
The most well-known method for using the relative strength index is the classic overbought and oversold approach. When RSI falls below 30, assets are considered oversold and may present a buying opportunity. Conversely, when RSI rises above 70, assets are deemed overbought and could be due for a pullback.
Traders often enter long positions when the relative strength index crosses above 30 and exit or short when it drops below 70. This method is particularly effective in range-bound markets, where prices oscillate between support and resistance.
Backtesting the S&P 500 from 2016 to 2026 reveals that classic RSI signals can yield consistent results during sideways periods. However, in trending markets, these signals may produce false entries. According to recent research on RSI Trading Signals and Market Valuation, the effectiveness of these signals often depends on broader market context, especially for public enterprises.
For risk management, traders typically set stop-loss orders just below recent lows for buys or above recent highs for sells. Take-profit targets are often placed at previous support or resistance levels. Remember, the relative strength index works best when combined with other tools for confirmation.
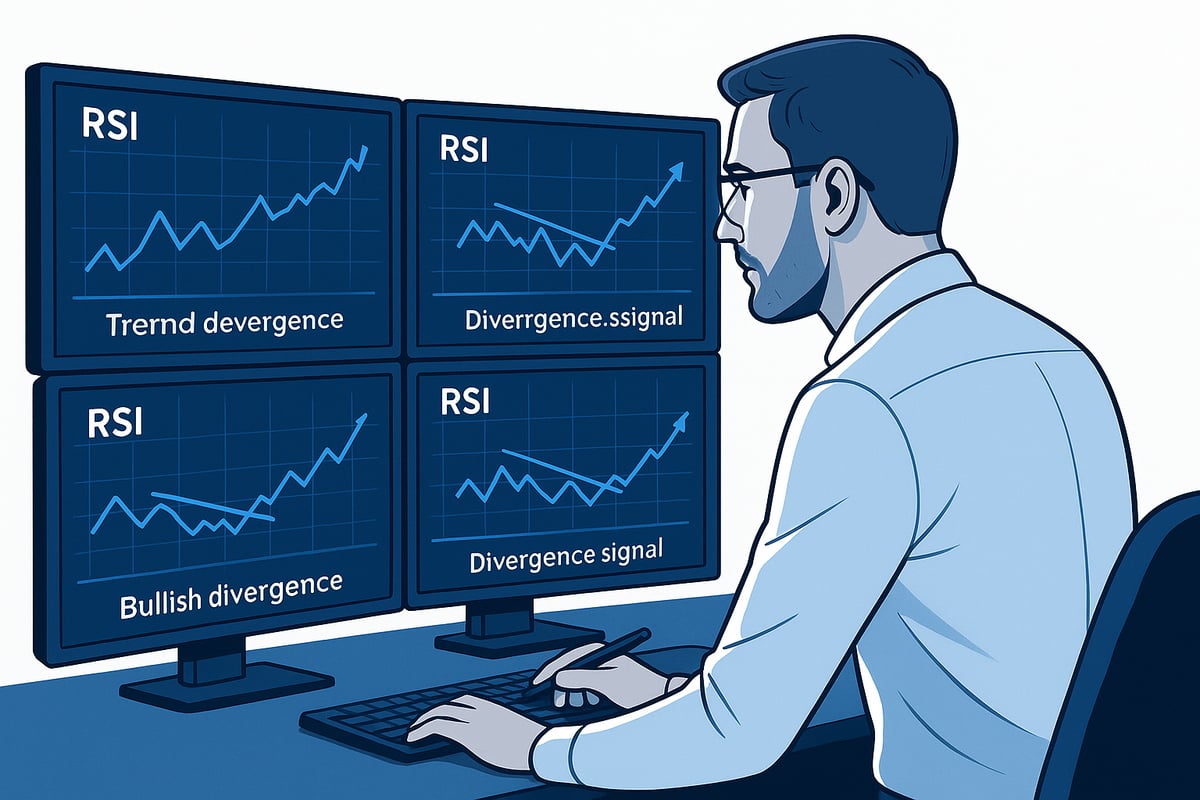
RSI Divergence: Spotting Trend Reversals Early
Divergence between price action and the relative strength index can serve as an early warning of potential trend reversals. Bullish divergence occurs when price charts form new lows while the RSI prints higher lows. This suggests underlying momentum is shifting, often preceding an upward reversal.
Bearish divergence is the opposite scenario. When prices make new highs but the relative strength index forms lower highs, it signals weakening momentum and a possible downturn. For example, during the 2020 Tesla rally, RSI divergence flashed caution before the stock corrected.
Timing reversals using divergence is challenging. These signals can appear well before the market actually turns. To increase reliability, many traders combine divergence with volume analysis or moving averages for confirmation.
Patience is critical. Not every divergence results in a reversal, but when combined with other indicators, it can help traders anticipate significant market moves.
RSI Trend Trading: Riding Momentum
The relative strength index is not just a reversal tool; it can also confirm the strength of ongoing trends. In strong uptrends, RSI often remains above 40, while in downtrends, it stays below 60. Trend traders use this behavior to ride momentum, entering trades in the direction of the prevailing trend.
Dynamic RSI bands can be adjusted to 80/20 in powerful trends, filtering out premature signals. For example, applying RSI trend-following strategies to the Nasdaq 100 from 2023 to 2025 showed that staying with the trend, rather than betting on reversals, reduced whipsaws and improved consistency.
Multi-timeframe analysis further enhances accuracy. By checking the RSI on daily, weekly, and monthly charts, traders gain a broader perspective, filtering out short-term noise.
Using the relative strength index for trend confirmation helps traders capture larger price movements and avoid being shaken out by minor corrections.
RSI Breakouts and Failure Swings
Breakout strategies involve using the relative strength index as an entry trigger when it breaks above 70 or below 30. Such moves often signal strong momentum and the start of a new trend. For instance, during the 2021–2022 crypto bull market, RSI breakouts provided early signals for major rallies.
Failure swings are another powerful pattern. If RSI fails to exceed its previous high in an uptrend or drops below its prior low in a downtrend, it indicates trend exhaustion. These setups are especially reliable in mature trends.
To boost confidence, traders often combine breakout and failure swing signals with candlestick patterns. This dual confirmation increases the odds of entering at the right moment.
By mastering these advanced tactics, traders can use the relative strength index to capture early moves and manage risk more effectively.
Advanced RSI Techniques and Modern Adaptations
The relative strength index has evolved far beyond its original design, offering traders sophisticated ways to adapt to today’s dynamic markets. By integrating advanced techniques, combining diverse indicators, and leveraging modern technology, you can harness the full power of the relative strength index for the future.
Combining RSI with Other Technical Indicators
Integrating the relative strength index with other technical indicators can significantly improve the accuracy of your trading signals. For example, pairing RSI with moving averages can help confirm whether a trend is gaining strength or losing momentum. Overlaying RSI signals with MACD crossovers often filters out false positives and highlights robust entry points.
A practical approach is to use Bollinger Bands alongside the relative strength index. When price action extends beyond the bands and RSI also enters overbought or oversold territory, the probability of a reversal increases. Another effective combination is using the relative strength index with Stochastic Oscillator during high-volatility periods, as this synergy often reduces noise.
| Indicator Pair | Strengths | Best Use Case |
|---|---|---|
| RSI + MA | Trend confirmation | Identifying sustained moves |
| RSI + MACD | Signal filtering | Avoiding whipsaws in choppy markets |
| RSI + Bollinger | Reversal signals | Spotting overextended moves |
| RSI + Stochastics | Volatility filtering | Fast-moving markets |
Using multiple indicators in tandem with the relative strength index helps create a robust framework, reducing the likelihood of acting on unreliable signals.
Multi-Timeframe RSI Analysis
Multi-timeframe analysis with the relative strength index provides a broader perspective and helps traders avoid being misled by short-term fluctuations. By examining RSI on daily, weekly, and even monthly charts, you gain valuable context to support your decisions.
For instance, a bullish signal on the daily relative strength index gains reliability if the weekly RSI also shows upward momentum. This alignment filters out market noise and increases the probability of successful trades. Top traders often start by analyzing the higher timeframe RSI to establish the dominant trend, then look for entry signals on lower timeframes.
Implementing this strategy involves:
- Checking the relative strength index on multiple timeframes before entering a trade
- Prioritizing signals that align across at least two timeframes
- Using higher timeframe RSI to set broader market bias
Multi-timeframe analysis reduces whipsaws and enhances your win rate, making it a vital component of a modern RSI strategy.
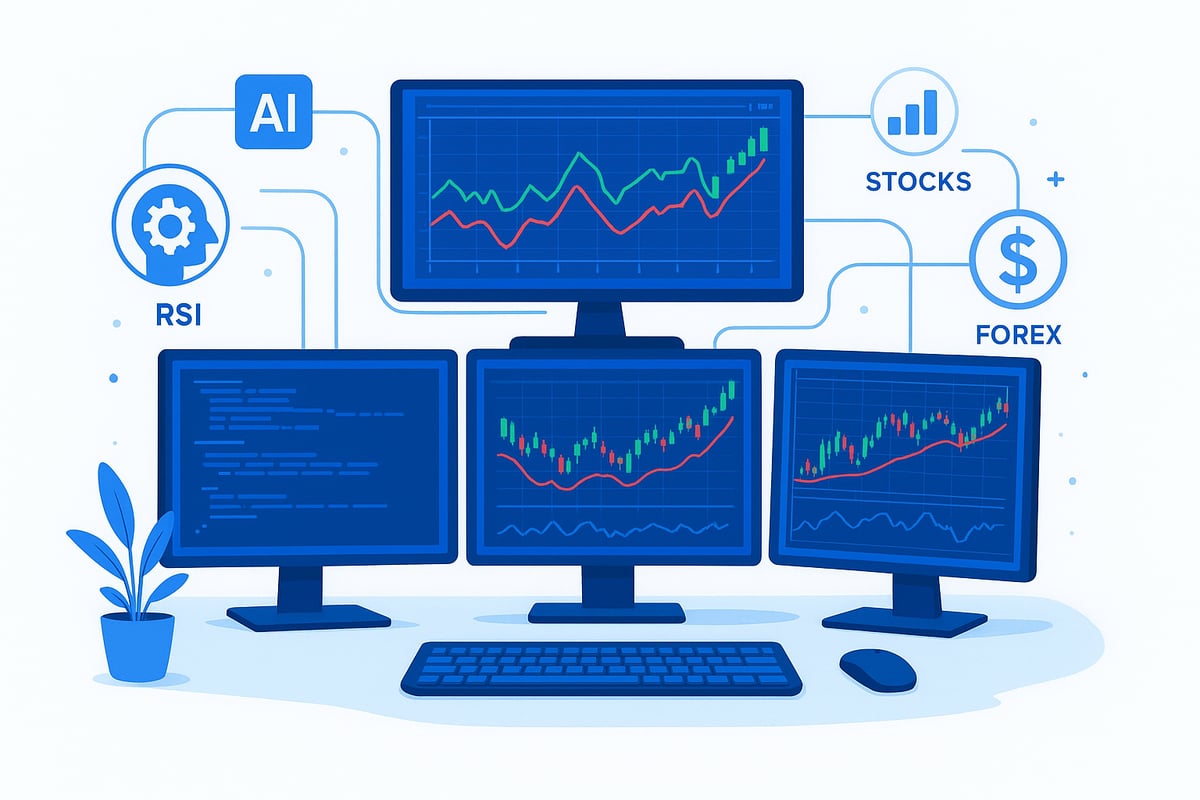
Algorithmic and AI-Powered RSI Strategies for 2026
Algorithmic trading has redefined how the relative strength index is used in the marketplace. Many trading bots now incorporate RSI as a core trigger for automated entries and exits, ensuring swift, emotion-free decision-making. Machine learning models analyze historical price and RSI data, adapting parameters dynamically for evolving market conditions.
Python-based RSI trading bots, for example, can scan hundreds of assets in real-time, executing trades when the relative strength index meets predefined criteria. AI-powered systems go further, integrating RSI with other data sources to predict price moves with greater accuracy.
Debates persist about whether these advanced strategies can consistently outperform the market, especially in light of the Efficient market hypothesis overview, which questions the predictability of price movements. Nonetheless, backtesting and real-world results show that automation enhances consistency and removes bias from RSI-based trading.
Adapting RSI for New Asset Classes and Market Conditions
The relative strength index remains adaptable as new asset classes and market environments emerge. Crypto markets, with their extreme volatility, often require custom RSI settings, such as shorter periods or adjusted overbought/oversold thresholds. ESG and thematic ETFs may benefit from tailored RSI approaches that reflect sector-specific trends.
For commodities, the relative strength index is effective in identifying cyclical turning points, particularly when combined with seasonal analysis. As new financial products like tokenized assets gain traction, traders must adjust RSI parameters and interpretation to match unique price behavior.
Continuous adaptation of the relative strength index is essential. Regularly reviewing and backtesting your RSI strategy ensures it remains effective in the face of ever-changing markets.
Practical Tips, Mistakes to Avoid, and Pro Insights
Mastering the relative strength index requires more than knowing formulas or settings. Traders in 2026 will need a disciplined process, an understanding of common pitfalls, and a commitment to continual learning. This section delivers actionable insights, error-proof strategies, and pro-level advice for using the relative strength index to its fullest potential.
Step-by-Step Guide to Implementing RSI Strategies
To leverage the relative strength index effectively, follow a systematic approach:
- Choose your charting platform: Select reliable software that supports RSI customization.
- Set RSI parameters: Decide on the period based on your asset and trading style.
- Identify signals: Watch for RSI readings below 30 or above 70 and look for divergence.
- Confirm with other tools: Cross-check signals using price action, volume, or the order book in trading explained for additional context.
- Execute trades: Enter positions only after confirmation, using stop-loss and take-profit orders.
- Manage risk: Never risk more than a set percentage per trade.
- Review performance: Keep a trade journal and analyze outcomes.
For example, when trading Apple stock in 2026, you might spot the relative strength index dropping below 30 on a daily chart. Before buying, confirm if the order book shows strong buying interest and review recent price patterns. Consistent journaling and reviewing your trades will help you adapt and improve your relative strength index strategy over time.
Common RSI Mistakes and How to Avoid Them
Even experienced traders can stumble when using the relative strength index. Here are the most frequent errors and how to sidestep them:
- Focusing only on RSI readings: Ignoring the trend can lead to losses.
- Chasing every overbought or oversold signal: Signals are less reliable in trending markets.
- Failing to customize settings: Using default periods for all assets ignores volatility differences.
- Overlooking divergence and failure swings: These often provide early warnings.
- Neglecting volume and order flow: RSI works best with confirmation from other indicators.
A common mistake in the 2022 meme stock frenzy was acting on every overbought relative strength index reading without considering the strong upward trend. Wikipedia highlights that RSI is less reliable in these situations. To avoid such pitfalls, always combine the relative strength index with broader analysis and adjust your approach for each asset.
Pro Tips: Maximizing RSI’s Potential in 2026
Unlock the full potential of the relative strength index by applying these pro-level strategies:
- Adjust periods for volatility: Shorter periods increase sensitivity, while longer ones filter out noise.
- Use RSI with volume: Volume spikes can confirm strong signals.
- Set alerts for RSI thresholds: Modern platforms let you automate notifications for key levels.
- Backtest your settings: Historical analysis helps refine your approach.
- Stay updated: Follow new research and adapt to market changes.
Top-performing traders often customize their relative strength index settings and set automated alerts to catch opportunities. Combining RSI with volume and price action increases reliability. Continuous learning and adaptation are essential for staying ahead in 2026.
Case Studies: RSI Successes and Failures in Recent Markets
Real-world examples show both the power and limits of the relative strength index. Consider the 2020–2021 tech stock rally. Traders who spotted RSI divergence early on Apple and Microsoft often captured trend reversals before major pullbacks. In contrast, during the 2021 crypto surge, many ignored persistent overbought RSI signals, missing out on extended gains.
Empirical research on RSI and Stock Purchase Decisions reveals that RSI plays a significant role in shaping buy and sell choices, especially in emerging markets. Backtesting on the S&P 500 and Bitcoin from 2016 to 2026 confirms that context and confirmation are vital for success.
The main takeaway? The relative strength index is a powerful ally, but only when used with discipline, flexibility, and awareness of market context.
Future of RSI: Trends, Tools, and Evolving Best Practices
The relative strength index is evolving rapidly, adapting to new technologies and trading environments. As we move toward 2026, traders and investors will see significant changes in how the relative strength index is applied, interpreted, and integrated with modern trading platforms.
Emerging RSI Trends and Innovations for 2026
As financial markets embrace advanced technology, the relative strength index is also undergoing a transformation. Artificial intelligence and big data analytics are now being used to enhance RSI signals, making them more adaptive and responsive to market shifts. Modern trading platforms often offer customizable RSI tools, enabling traders to set real-time alerts and automate trading strategies based on personalized thresholds.
One key innovation is the integration of the relative strength index within decentralized finance (DeFi) platforms. Traders can now access real-time RSI signals for tokenized assets, expanding the indicator’s relevance beyond traditional stocks and forex. Mobile trading apps have also advanced, providing instant RSI notifications and seamless execution.
Empirical studies, such as the RSI in KLSE Market Trade, highlight the global adoption and effectiveness of the relative strength index in diverse markets, including the fast-growing Malaysian exchange. These findings reinforce RSI’s adaptability and predictive power across various asset classes.
Looking forward, expect more AI-powered RSI tools, integration with algorithmic bots, and enhanced visualization features. Staying updated with these innovations will be essential for maximizing RSI’s potential in a rapidly changing market landscape.
RSI and Market Cycles: Learning from History
Understanding how the relative strength index performs across different market cycles is crucial for long-term success. Historically, RSI has provided valuable signals during major turning points, such as the 2008 financial crisis and the dot-com bubble. By identifying periods of extreme overbought or oversold conditions, RSI has helped traders anticipate reversals and adjust their strategies accordingly.
For example, before the 2008 crisis, the relative strength index signaled cyclical tops and bottoms across global indices. Wikipedia notes that RSI’s ability to highlight these moments made it a trusted tool for both institutional and retail investors. By studying past RSI performance, traders can recognize patterns that often repeat during market expansions and contractions.
However, the relative strength index is not infallible. In trending markets, it may generate false signals, especially when used in isolation. Context is vital. Combining RSI readings with other technical indicators, such as moving averages or price-to-earnings ratios, enhances reliability and reduces risk.
To maximize the benefits of RSI in future market regimes, regularly review historical case studies and adapt your approach to emerging market conditions. Learning from history remains one of the most effective ways to refine your RSI strategy.
Customizing RSI for Your Trading Style and Goals
The relative strength index is a versatile tool, but its true power lies in customization. Traders can tailor RSI settings to match their unique strategies, timeframes, and risk tolerance. Whether you are a swing trader seeking quick signals or a long-term investor focused on portfolio rotation, adjusting RSI periods and thresholds can make a significant difference.
Consider these customization examples:
| Trading Style | RSI Period | Typical Use | Benefit |
|---|---|---|---|
| Swing Trading | 7–9 | Quick entry/exit signals | Captures short-term moves |
| Day Trading | 5–14 | Real-time monitoring | Rapid execution |
| Long-Term | 21–28 | Portfolio rebalancing | Filters market noise |
| ETF Rotation | 14–21 | Sector/asset switching | Optimizes allocation |
Data from Fidelity and user studies confirm that personalized RSI settings lead to improved performance and higher confidence. Top traders recommend regular backtesting and ongoing refinement of RSI parameters to keep pace with changing volatility and asset behavior.
In summary, unlocking the full potential of the relative strength index requires continuous adaptation and a commitment to learning. By aligning RSI settings with your trading style and market goals, you position yourself for greater consistency and success in 2026.
As you’ve seen throughout this guide, mastering RSI strategies is about more than just knowing the numbers—it's about understanding the stories, patterns, and lessons behind market moves. If you're eager to deepen your insights and put these techniques into practice, imagine having access to interactive charts, AI-powered summaries, and real historical context all in one place. We’re building a platform designed for investors and learners like you to explore financial markets through a new lens. Ready to shape the future of how we understand market history? Join Our Beta