
Order Book Guide: Mastering Market Depth in 2025
Imagine being able to anticipate market moves before they happen. The secret? Mastering the hidden language of the order book.
In today's fast-paced markets, understanding the order book is more important than ever. This guide will show you how top traders use order book data to gain an edge in 2025.
We will cover the basics, explain key terms, reveal advanced visualization tools, and share actionable strategies. You will also discover the latest trends shaping order book dynamics.
Are you ready to level up your trading skills? Let’s dive in and unlock the power of market depth together.
Understanding Order Books: The Core of Market Depth
Imagine stepping onto a bustling trading floor, but instead of shouting brokers and paper slips, you see a digital screen filled with constantly shifting numbers. This is the heart of every modern financial market—the order book. Understanding how the order book works is essential for grasping market depth and making smarter trading decisions in 2025.
What Is an Order Book?
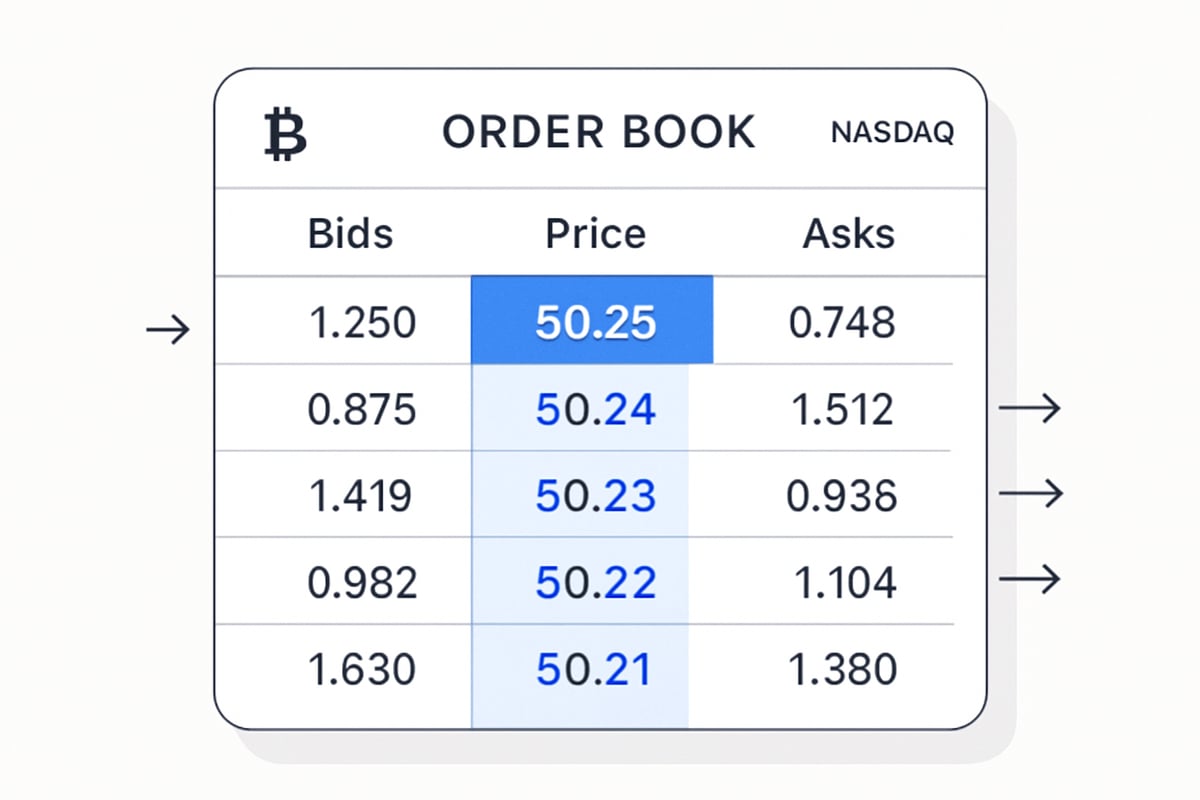
An order book is a real-time ledger showing all buy and sell orders for a specific asset on an exchange. It lists the prices and sizes at which traders are willing to buy (bids) or sell (asks), updating instantly as new orders arrive or get filled.
Historically, order books were physical ledgers, managed by hand in open-outcry pits. With the rise of electronic trading, order books went digital, becoming the backbone of modern exchanges. Today, millions of orders are processed every day on platforms such as Coinbase for cryptocurrencies and Nasdaq for stocks.
The order book matches buyers and sellers, facilitating the process of price discovery. Exchanges use a matching engine to pair orders based on price and time, ensuring fairness and transparency. The structure is straightforward but powerful:
| Side | Price | Amount |
|---|---|---|
| Bid | $49,900 | 1.2 BTC |
| Bid | $49,850 | 0.8 BTC |
| Ask | $50,050 | 0.5 BTC |
| Ask | $50,100 | 1.0 BTC |
Each row in the table represents a price level where traders want to transact. Bids stack below the current market price, while asks sit above it.
A robust order book increases market transparency, allowing anyone to see where liquidity sits and how deep the market is at each price. This transparency is crucial for price discovery and helps prevent manipulation. As algorithmic and high-frequency trading have grown, order books now update at lightning speed—sometimes thousands of times per second—reshaping the very structure of market depth.
Key Order Book Terminology
To navigate an order book effectively, you’ll need to speak its language. Here are some essential terms:
- Top of the Book: The highest bid and lowest ask, where trades are most likely to execute.
- Spread: The difference between the top bid and top ask, indicating real-time liquidity.
- Price Levels: Multiple orders at the same price, forming layers of market interest.
- Market Order vs. Limit Order: Market orders fill immediately at the best price available, while limit orders wait for a specific price in the order book.
- Slippage: Occurs when large orders fill at multiple price levels, often during low liquidity.
- Trade History: The record of executed trades, showing how orders in the order book are matched.
Let’s bring this to life with a real-world example. Imagine a BTC-USD order book showing a $50,000 bid for 2 BTC and a $50,200 ask for 1 BTC. If you place a market buy order, it will match with the lowest ask, moving the price and updating the book instantly.
For a deeper dive into these and other essential finance concepts, check out Key Finance Terms Explained.
Mastering these terms and reading the order book fluently can reveal hidden patterns in market depth, helping you anticipate price moves and trade with greater confidence.
Visualizing Market Depth: Tools and Techniques for 2025
The ability to visualize market depth can make or break a trading strategy. In 2025, order book analysis has evolved, offering traders sharper insights than ever before. Let’s break down the essential tools and techniques you’ll need to interpret, visualize, and act on order book data with confidence.
Reading Order Book Data
At its core, the order book is a live ledger showing who wants to buy or sell and at what price. Modern trading platforms present this data in columns, typically labeled as:
- Price: The level at which buyers or sellers are willing to trade.
- Amount: The volume available at that price.
- Total: The cumulative volume up to this price level.
- Count: How many individual orders make up the total.
Reading an order book involves more than glancing at numbers. You’ll want to identify liquidity zones, which are price levels with significant volume. These can act as support or resistance, influencing short-term moves.
Watch for thin areas in the order book, where limited volume can lead to sudden price jumps. Spotting buy/sell imbalances helps you anticipate which side is more aggressive. For example, a surge in bids with few asks often leads to upward price pressure.
Order book updates are now nearly instantaneous. Platforms in 2025 refresh data many times per second, crucial during news or high volatility. Hidden orders and iceberg orders—where only a portion is visible—can mask true market intent.
If you want to dive deeper into minimizing slippage and improving execution, check out this resource on leveraging order book data for market insights.
During fast-moving markets, keep your eyes on the order book. Quick shifts in depth or sudden walls can signal an impending move. Practice by watching a BTC-USD order book in real time to get comfortable with the flow.
Depth Charts and Visual Representations
A depth chart is the visual heartbeat of market depth. It maps the cumulative bids and asks across price points, letting you see supply and demand at a glance.
- X-axis: Represents price.
- Y-axis: Shows cumulative volume.
The chart splits into two lines:
- The buy side (bid line) rises as you move left from the current price, reflecting buyers.
- The sell side (ask line) rises as you move right, showing sellers.
One key benefit of a depth chart is the ability to spot buy walls (large clusters of bids) and sell walls (stacked asks). These can act as psychological barriers, often stalling or reversing price movement.
Common patterns include:
- Walls: Sudden vertical jumps, indicating strong support or resistance.
- Cliffs: Sharp drops, suggesting thin liquidity.
- Gaps: Areas with little or no volume, which can lead to rapid price swings.
For example, spotting a large buy wall in a crypto depth chart might suggest strong support, while a gap above could mean a quick breakout if that wall is breached.
AI-powered analytics now help traders interpret these charts, highlighting patterns and shifts that were easy to miss in the past. In 2025, depth chart tools are more interactive and insightful than ever.
Advanced Visualization Tools in 2025
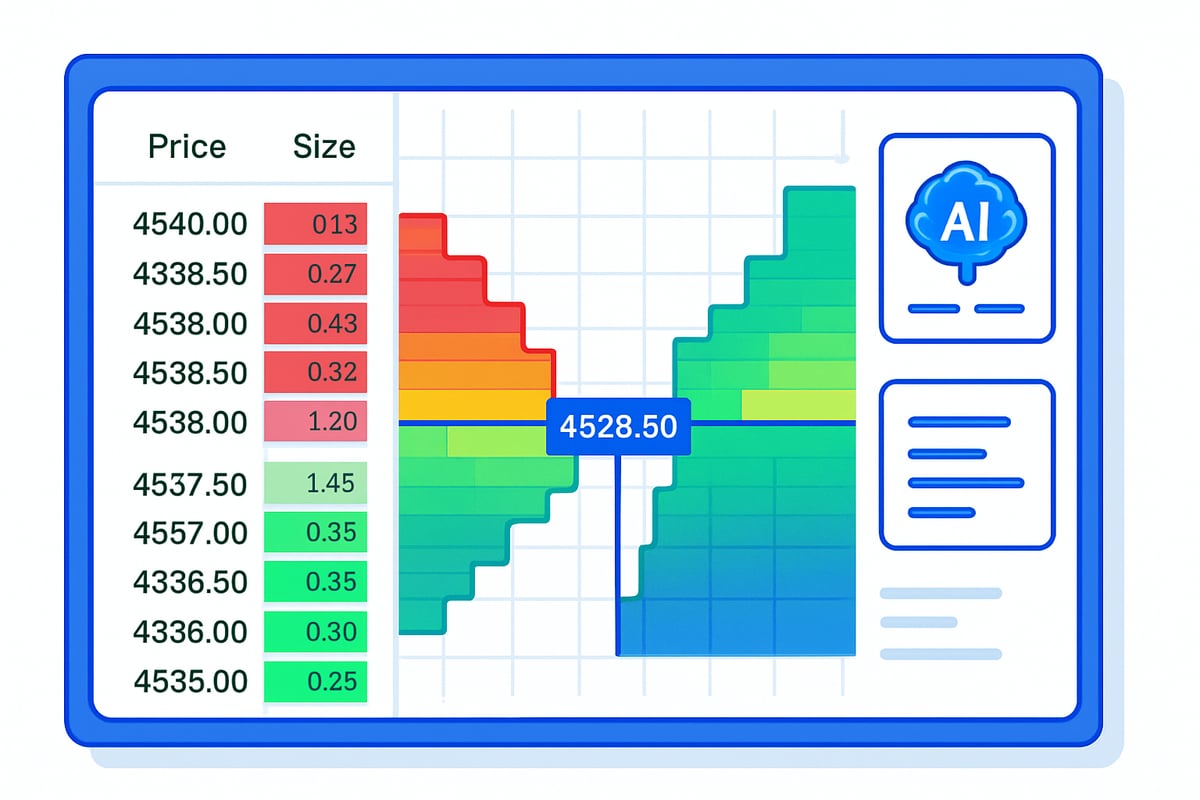
Visualization technology for order book data has exploded in recent years. Heatmaps, 3D charts, and real-time analytics give traders a multi-dimensional view of liquidity and activity.
Heatmaps use color intensity to show where the most orders are stacked. The brighter or darker the color, the more liquidity sits at that price. 3D charts let you view layers of the order book, revealing depth and volume in a single glance.
AI-driven analysis now identifies patterns, predicts liquidity shifts, and even integrates news sentiment. Imagine receiving an alert when a major news event triggers a sudden change in order book depth—giving you a critical edge.
Customizable dashboards are now standard, letting traders track multiple assets, set alerts, and tweak views to their style. The adoption of these advanced visualization platforms has soared, with both retail and institutional traders relying on them for daily decisions.
Here’s a quick comparison of popular visualization features:
| Tool | Visualization Type | AI Integration | Custom Alerts | User Base |
|---|---|---|---|---|
| Heatmaps | 2D/Color Intensity | Yes | Yes | All levels |
| 3D Depth Charts | 3D Layered | Partial | Yes | Advanced |
| Sentiment Dashboards | Text & Visual | Yes | Yes | Pro/Institutional |
In 2025, mastering these tools is essential for making the most of order book data and staying ahead of the curve.
How Order Book Dynamics Shape Price Movements
Order book dynamics are at the heart of every price movement you see on a trading chart. The way orders are placed, matched, and filled reveals the real-time tug of war between buyers and sellers. By understanding these mechanics, traders can spot price shifts and anticipate market moves before they happen.
The Mechanics of Order Matching and Execution
At its core, an order book is a live record of buy and sell interest for an asset. Every time a trader submits a buy or sell order, it enters the order book and waits to be matched. Modern exchanges use sophisticated matching engines that pair compatible orders, following a strict set of rules.
The most common rule is price-time priority. This means the best price is matched first, and if there are multiple orders at the same price, the earliest order gets filled first. This system keeps the order book fair and transparent.
Imagine a large market order to buy 1,000 shares appears in the order book. If the top ask only has 200 shares, the engine fills that portion, then moves to the next lowest ask. This process can cause the price to jump as the order "walks" up the book. This is why large trades often impact price.
Market makers play a vital role by providing both buy and sell orders, adding depth and liquidity. They profit from the spread—the difference between the highest bid and lowest ask. In highly liquid markets, this spread is tiny, while in less active markets, it can be wide.
Here's a quick comparison:
| Market Type | Typical Spread | Order Book Depth | Price Stability |
|---|---|---|---|
| Highly Liquid | Very Narrow | Deep | High |
| Illiquid/Thin Book | Wide | Shallow | Low |
Order book dynamics are constantly evolving, with millions of orders processed daily. The combination of matching rules, market maker activity, and the sheer volume of trades shapes every tick in the market.
Market Depth and Liquidity
Market depth describes the number of buy and sell orders at each price level in the order book. Deep order books, filled with large volumes at many levels, help keep prices stable even during sudden surges in trading activity. Shallow or "thin" order books are more fragile—prices can move dramatically with just a few trades.
Liquidity is a direct result of order book depth. When liquidity is high, traders can enter or exit positions with minimal price impact. In contrast, thin liquidity can lead to slippage, where trades execute at less favorable prices than expected.
Flash crashes are a dramatic example of thin order books in action. When liquidity dries up, even small market orders can trigger rapid, severe price drops. Liquidity providers, such as institutional traders and market makers, help buffer against these swings by continuously placing orders on both sides of the book.
Monitoring order book depth is crucial for both retail and institutional traders. In 2025, advanced tools and analytics make it easier than ever to track these changes in real time. For those interested in the latest methods for evaluating liquidity and stability, Measuring Treasury Market Depth offers valuable insights into how professionals analyze and respond to shifts in market depth.
Average depth levels for major assets have grown as technology and participation increase, but risks remain. By keeping a close eye on the order book, traders can spot early signs of volatility and adjust their strategies to protect profits.
Practical Guide: Using Order Book Data to Trade Smarter in 2025
Ready to turn order book insights into smarter trades? This step-by-step guide walks you through everything you need to analyze, interpret, and act on market depth data like a pro in 2025. Whether you’re a beginner or looking to refine your strategies, these practical tips will help you leverage the order book for more informed decisions.
Step 1: Setting Up Your Trading Dashboard
Your trading dashboard is your mission control for order book analysis. Start by choosing a platform that offers robust order book data, customizable layouts, and advanced visualization tools. Leading options in 2025 include Coinbase Advanced, Binance Pro, and other platforms that prioritize speed and security.
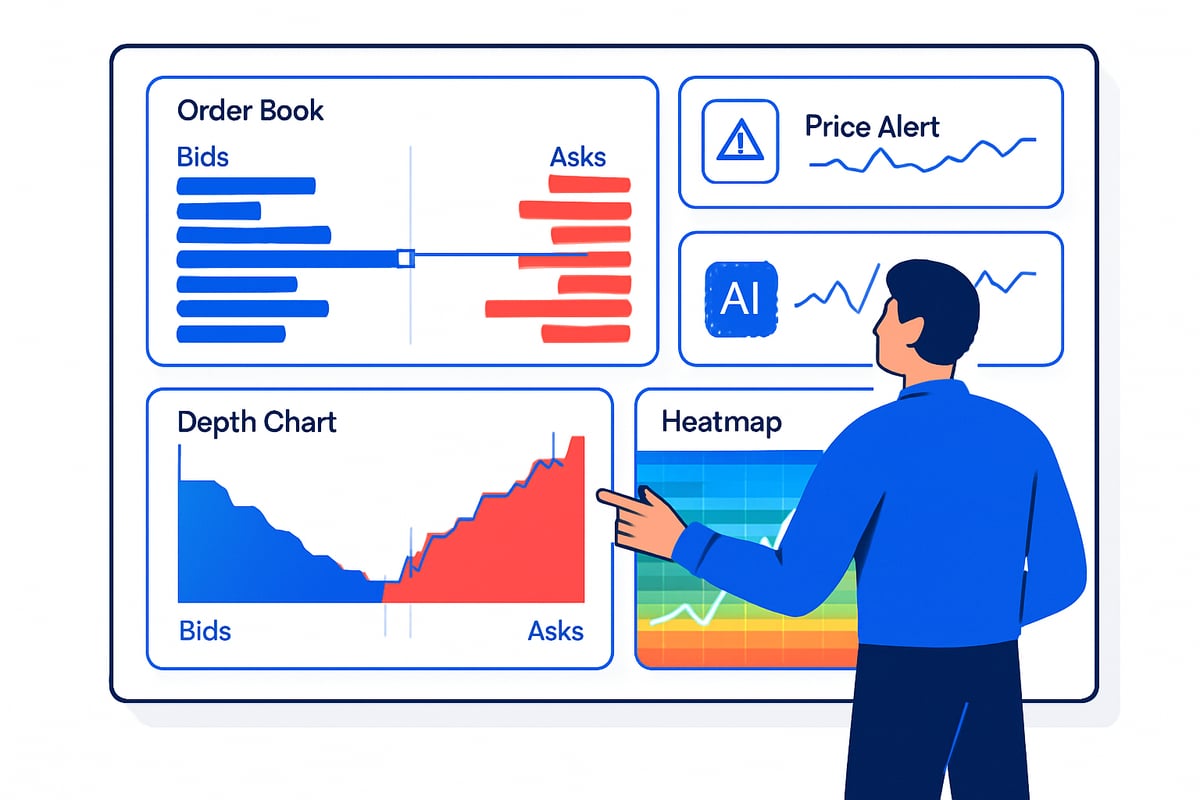
To optimize your workflow, configure your dashboard to display:
- Live order book with bid/ask depth
- Real-time spread and trade history
- Depth charts, heatmaps, and price alerts
- Multi-asset monitoring for broader market awareness
Here’s a quick comparison of popular platforms:
| Platform | Order Book Features | Visualization Tools | Security | Latency |
|---|---|---|---|---|
| Coinbase Advanced | Depth, trade history | Heatmaps, alerts | High | Low |
| Binance Pro | Multi-level depth, AI | Custom dashboards | High | Low |
Data security is vital. Always enable two-factor authentication and ensure your chosen platform minimizes latency—milliseconds can matter when tracking the order book. Customizing your dashboard to highlight order book metrics will put you ahead of the pack.
Step 2: Interpreting Order Book Signals
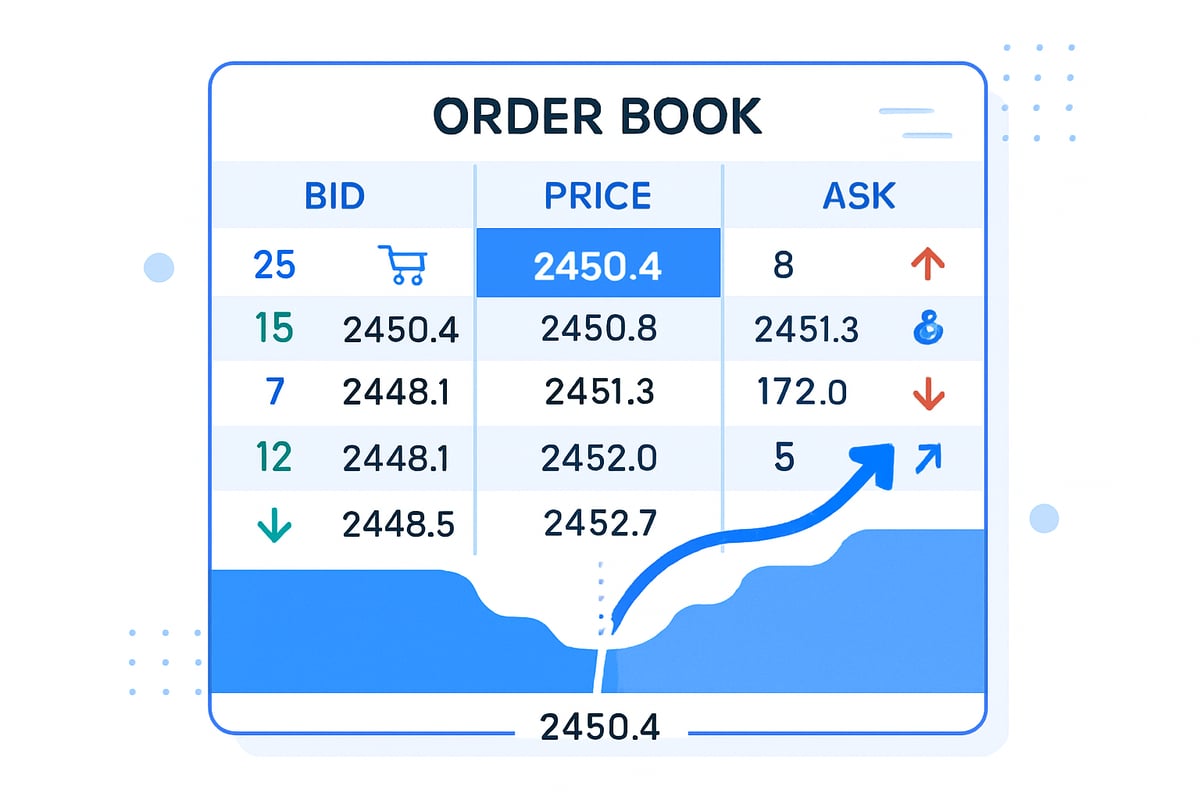
Now that your dashboard is set, it’s time to decode the order book’s hidden messages. Start by scanning for buy walls (large clusters of bids) and sell walls (concentrated asks). These often signal strong support or resistance zones.
Key signals to watch for:
- Rapid changes at the top of the order book, hinting at breakout potential
- Imbalances where aggressive buyers or sellers dominate, which can foreshadow price swings
- Sudden appearance or disappearance of large orders, possibly indicating manipulation
Order flow—the sequence of trades and their size—reveals short-term momentum. For example, if you see the order book’s highest bids rising quickly, buyers may be preparing for an upward move.
Stay alert for spoofing or fake orders. These can distort the order book and trick traders into making poor decisions. In fact, studies show order book manipulation attempts remain prevalent in digital asset markets.
To deepen your skills in spotting these signals, check out Essential Market Analysis Skills for Traders, which covers advanced order book and market depth techniques.
Step 3: Executing Trades Based on Market Depth
Execution is where your order book analysis pays off. Deciding between market and limit orders depends on current book conditions. In a deep order book, market orders are more likely to fill at your desired price with minimal slippage. In thinner markets, limit orders help you control entry and exit points.
Strategies to manage large trades:
- Break your order into smaller chunks to avoid moving the market
- Use layering—placing multiple limit orders at different price levels—to maximize fill probability and minimize impact
- Employ advanced orders like stop-limit to protect against rapid reversals
Here’s a sample multi-level sell order using pseudo-code:
SELL 1 BTC @ $50,100
SELL 1 BTC @ $50,200
SELL 1 BTC @ $50,300
Pay attention to fill rates and execution quality. In 2025, platforms provide analytics on average fill times and slippage, helping you fine-tune your order book strategies for every trade.
Step 4: Adapting to Real-Time Order Book Changes
Markets shift in seconds. Successful traders monitor the order book continuously, ready to adapt as conditions change. Set alerts for significant moves in depth or spread—these often precede volatility spikes or liquidity drains.
During news events, the order book can thin out or shift rapidly. Automate your response with AI-driven tools that track real-time changes and recommend adjustments. For example, if a sudden sell wall appears after a major announcement, you may want to delay buying or adjust your strategy.
Discipline is key. Avoid emotional reactions to sudden order book shifts. Instead, rely on your analysis and pre-set rules to guide decisions. With practice, you’ll react faster and more confidently to real-time market depth changes.
The Future of Order Books: Trends, Risks, and Opportunities in 2025
The landscape of trading is rapidly evolving, and the order book stands at the center of these changes. As we look toward 2025, understanding what’s next for order books can give traders a powerful edge. Let’s explore the transformative trends, emerging risks, and new opportunities that will shape the way we trade in the coming year.
Algorithmic and High-Frequency Trading
Algorithmic and high-frequency trading (HFT) have become the driving forces behind modern order book dynamics. In 2025, these automated strategies account for a significant share of trading volume across global markets. Algorithms can spot micro-movements in the order book and exploit fleeting liquidity gaps—often in milliseconds.
Retail traders now face both opportunities and challenges as algorithms create and remove buy/sell walls to influence perception and trigger reactions. For example, a sudden surge in orders at a specific price might be the result of an HFT bot rather than true market intent. This fast-paced environment can lead to both increased liquidity and bouts of artificial volatility.
It's critical to recognize when algorithmic activity is shaping the order book. Tools that help traders detect algorithmic footprints in volatile markets are becoming essential. Regulators are also stepping up, introducing safeguards to prevent manipulation and ensure fair access for all participants.
Decentralized Exchanges and On-Chain Order Books
The rise of decentralized exchanges (DEXs) and on-chain order books is transforming how trades are executed. Unlike traditional centralized platforms, DEXs operate transparently on public blockchains, allowing anyone to view order book activity in real time. This openness provides unique advantages but also brings trade-offs in speed and privacy.
Automated market makers (AMMs) and hybrid models are leading the way, with innovations like Uniswap v4 increasing visibility into liquidity pools and order book flows. DEX trading volume continues to grow as more traders seek control and transparency. However, on-chain order books can expose users to unique security risks, such as front-running and smart contract vulnerabilities.
Here’s a quick comparison:
| Feature | Centralized Order Book | Decentralized Order Book |
|---|---|---|
| Speed | High | Variable |
| Transparency | Limited | Full (on-chain) |
| Privacy | Higher | Lower |
| Security Risks | Operational | Smart contract, on-chain |
As DEX adoption rises, mastering both centralized and decentralized order book models will be key for versatile traders.
Innovations in Order Book Analytics
Order book analytics are entering a new era, powered by AI and machine learning. Advanced platforms now combine traditional order book data with alternative sources like news sentiment and macroeconomic indicators. This creates a richer picture of market depth and helps traders forecast liquidity shifts and price changes with greater accuracy.
AI models can scan millions of order book updates, flagging suspicious patterns or potential manipulation in real time. These innovations are no longer limited to institutional desks—retail traders have increasing access to customizable dashboards and predictive tools. In fact, adoption rates for AI-driven order book analytics are expected to reach new highs among professionals in 2025.
The democratization of these tools means more traders can make informed decisions, leveraging insights that were once exclusive to the big players. As machine learning continues to evolve, expect order book analysis to become even more precise and actionable.
Key Risks and How to Mitigate Them
With all these advancements, new risks emerge in order book trading. Spoofing—where traders place large fake orders to mislead others—remains a major concern. Liquidity traps and flash crashes can occur when the order book suddenly thins, causing prices to swing wildly and catching traders off guard.
Overreliance on order book signals alone can also be risky. Sometimes, a seemingly bullish order book may be artificially constructed, leading to false trading signals. To mitigate these pitfalls, traders should combine order book data with broader market analysis, use alerts for unusual activity, and adopt strict risk management practices.
Regulators are responding with new policies to protect market integrity and punish manipulative tactics. Staying aware of these risks, and learning to spot red flags in the order book, will be crucial for anyone looking to thrive in 2025’s dynamic markets.
Glossary of Essential Order Book Terms for 2025
Gain clarity on order book concepts with this quick-reference glossary, updated for 2025.
| Term | Definition & Example Usage |
|---|---|
| Bid | The price a buyer is willing to pay. E.g., The highest bid in the order book is $100. |
| Ask | The price a seller wants. E.g., The lowest ask is $101. |
| Spread | Difference between highest bid and lowest ask. A tight spread means more liquidity. |
| Market Order | An order to buy or sell immediately at the best available price. Market orders fill from the order book instantly. |
| Limit Order | An order to buy/sell at a specific price or better. Limit orders rest on the order book until filled. |
| Slippage | The difference between expected and actual execution price. Large orders may cause slippage in thin markets. |
| Liquidity | How easily an asset can be bought or sold. High liquidity in the order book reduces slippage. See our guide on the quick ratio for deeper liquidity insights. |
| Depth | The volume available at each price level. A deep order book can absorb large trades. |
| Spoofing | Placing fake orders to mislead traders. Spoofing manipulates order book signals. |
| Iceberg Order | A large order split into visible and hidden parts. Iceberg orders mask true size in the order book. |
| Matching Engine | The system that pairs buy and sell orders. The matching engine processes thousands of order book updates per second. |
This glossary should help both new and advanced traders navigate the order book with confidence in 2025.
Now that you have a solid grasp on order books and how to spot patterns in market depth, imagine having a platform that lets you dive even deeper into these dynamics using real historical data. With interactive charts, AI-powered summaries, and news that connects past events to today's trends, you can truly level up your trading insights for 2025 and beyond. If you are curious to explore the stories behind every market move and want to be part of shaping this unique tool, Join Our Beta and start uncovering the secrets of the financial markets with us.