
Price-to-Earnings Ratio Guide: Understanding Value in 2026
In 2026, accurately assessing a company's value is critical as stock markets transform and competition increases. Investors need reliable tools to make sense of fluctuating prices and shifting trends.
The price-to-earnings ratio stands out as one of the most trusted metrics for evaluating stocks. This guide will break down the price-to-earnings ratio, making its calculation and interpretation clear for investors of all levels.
You will discover the basics, step-by-step calculation, real-world examples, sector comparisons, advanced uses, and key limitations. With practical insights and up-to-date analysis, you'll be equipped to make smarter investment decisions.
Leverage this guide to strengthen your stock analysis and navigate the complexities of modern markets with confidence.
What is the Price-to-Earnings Ratio?
Understanding the price-to-earnings ratio is fundamental for anyone evaluating stocks in 2026. This metric serves as a cornerstone for equity analysis, helping investors quickly gauge whether a company’s shares are attractively valued. As markets become more dynamic and competitive, grasping the essentials of the price-to-earnings ratio can give you a decisive edge.
Definition and Core Concept
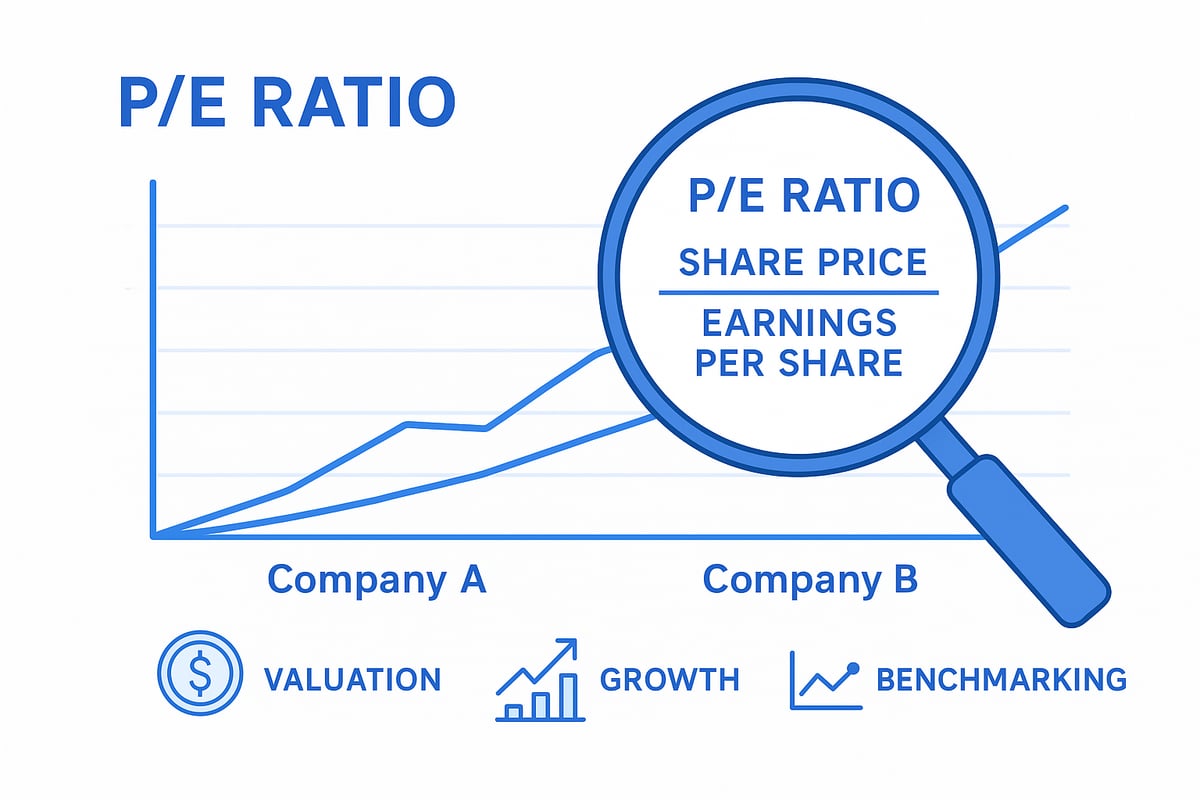
At its core, the price-to-earnings ratio compares a company’s current share price to its earnings per share (EPS). This figure is often called the “price multiple” or “earnings multiple.” By dividing the share price by the EPS, investors get a snapshot of how much they’re paying for each dollar of company earnings.
For example, if a company’s stock trades at $50 and its EPS is $5, the price-to-earnings ratio is 10. This means investors are willing to pay $10 for every $1 of earnings.
Here’s a quick reference:
| Company | Share Price | EPS | P/E Ratio |
|---|---|---|---|
| Alpha | $50 | $5 | 10 |
| Beta | $80 | $8 | 10 |
The price-to-earnings ratio is widely used by analysts to compare valuations across companies, sectors, and time periods. According to industry competitors, “Investors use P/E to compare a company’s valuation to its peer group and historical performance.” For a more in-depth overview, you can visit this price-to-earnings ratio definition.
Historical Context and Evolution
The price-to-earnings ratio has been a staple in financial analysis for nearly a century. Early investors used it primarily to identify undervalued stocks, but its role has evolved significantly as markets matured. Over the decades, the importance of the price-to-earnings ratio grew, especially as more data became available and markets globalized.
Historically, average price-to-earnings ratios have shifted based on economic cycles, market sentiment, and innovation. For example, the S&P 500’s average P/E ratio has ranged from the low teens to over 20 in periods of market optimism. In the 2026 landscape, rapid technological change and market volatility have made interpreting the price-to-earnings ratio even more nuanced.
Today, investors must consider how innovation, new business models, and economic uncertainty affect earnings and, by extension, the price-to-earnings ratio. This historical perspective is crucial for understanding current trends and making informed decisions.
Why Investors Rely on P/E
The price-to-earnings ratio is valued for its simplicity and versatility. It acts as a quick screening tool to identify potentially undervalued or overvalued stocks. Investors use it to compare companies within the same industry and track changes over time. The price-to-earnings ratio also serves as a benchmark against broader indices like the S&P 500.
For instance, the S&P 500’s average price-to-earnings ratio in the mid-2020s has often ranged between 18 and 22. By comparing an individual company’s ratio to these benchmarks, investors can spot discrepancies that may warrant further research.
However, the price-to-earnings ratio is not without limitations. It should never be used in isolation. Context is key—differences in sector norms, company growth rates, and accounting practices can all influence the ratio’s interpretation. Savvy investors always supplement their analysis with additional metrics and qualitative research.
Calculating the P/E Ratio: Step-by-Step Guide
Understanding how to calculate the price-to-earnings ratio is essential for any investor aiming to evaluate stocks in 2026. This step-by-step guide will walk you through the process, ensuring you can confidently analyze and compare company valuations.
Step 1: Gather Required Data
Begin by collecting the essential information needed for your price-to-earnings ratio calculation. You must identify the current market price per share for the company you are analyzing. This figure is widely available on financial news platforms and stock market apps.
Next, obtain the earnings per share (EPS). For accuracy, always use the diluted EPS, which accounts for all potential shares outstanding. This approach provides a more complete picture and avoids overstating a company’s profitability. The diluted EPS can be found in the company’s latest quarterly or annual financial statements.
Without up-to-date and reliable data, your price-to-earnings ratio will not reflect the true value of the company. Make sure to verify both the share price and EPS from trusted sources before proceeding.
Step 2: Apply the Formula
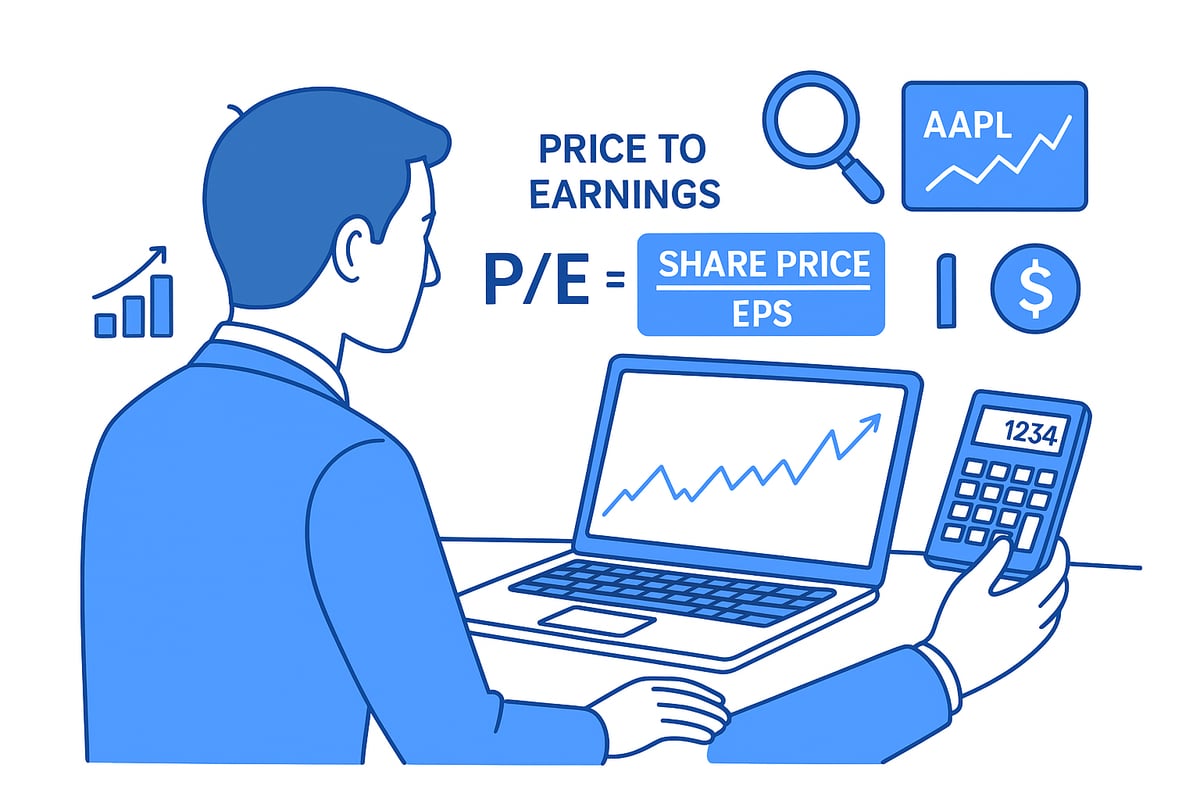
With your data in hand, apply the core formula for the price-to-earnings ratio:
P/E Ratio = Share Price / Earnings Per Share (EPS)
For example, if a stock trades at $80 and its diluted EPS is $6, the calculation is:
P/E Ratio = $80 / $6 = 13.3
Alternatively, you can use the company’s market capitalization divided by its net income, especially when comparing larger groups. For a broader view of individual company ratios within a specific index, you can consult resources such as the S&P 500 P/E Ratio by Company – 2025 to benchmark your results.
These calculations allow for quick comparisons, but always remember that the price-to-earnings ratio is only as accurate as the data used.
Step 3: Choose the Right P/E Type
There are two main types of price-to-earnings ratio: trailing and forward. Trailing P/E uses earnings from the past four quarters, reflecting actual performance. Forward P/E relies on projected earnings for the next 12 months, incorporating analyst forecasts and market expectations.
In 2026, forward P/E is increasingly relevant as market conditions and technology trends shift rapidly. Use trailing P/E for historical comparisons and forward P/E for anticipating future performance. Always specify which type you are using, since the choice can significantly affect your investment analysis.
Selecting the appropriate price-to-earnings ratio type ensures that your valuation remains consistent and meaningful in a changing market.
Step 4: Adjust for Special Cases
Some situations require special adjustments when calculating the price-to-earnings ratio. If a company operates on a non-standard fiscal year or reports extraordinary one-time items, you may need to normalize earnings to maintain comparability.
Companies with negative or highly volatile earnings present additional challenges, since the ratio may be undefined or misleading. For private firms, use the estimated market value and net income, but recognize that these figures may lack the transparency of public companies.
Adapting your approach to each scenario ensures that your price-to-earnings ratio reflects reality rather than distorted figures.
Step 5: Common Pitfalls in Calculation
When working with the price-to-earnings ratio, be aware of common mistakes. Using outdated or non-comparable EPS figures can lead to inaccurate conclusions. Always rely on consistent, current data sources and verify that the EPS reflects the most recent reporting period.
Remember, the price-to-earnings ratio does not work for companies that are not profitable. Attempting to apply it in these cases can result in misleading investment decisions.
By avoiding these pitfalls, you enhance the reliability of your analysis and make more informed choices based on the price-to-earnings ratio.
Interpreting the P/E Ratio: What the Numbers Really Mean
Understanding the price-to-earnings ratio is essential for interpreting what market numbers truly reveal about a company's value. Investors often face challenges in distinguishing between a stock that is genuinely undervalued and one that is simply out of favor. In this section, we break down how to interpret the price-to-earnings ratio across different contexts, helping you make more informed decisions in 2026.

High vs. Low P/E: Signals and Implications
A high price-to-earnings ratio often reflects strong growth expectations, investor confidence, or possible overvaluation. In contrast, a low price-to-earnings ratio may signal undervaluation, higher risk, or underlying company challenges.
Consider the following table for a quick comparison:
| Scenario | P/E Ratio | Possible Interpretation |
|---|---|---|
| Company A | 13.3 | Modest growth, potential value |
| Company B | 17.5 | Higher growth or overvaluation |
If a stock trades at a much lower price-to-earnings ratio than its peers, it can be a warning sign rather than an automatic bargain. Always investigate further before making conclusions.
Sector and Industry Context
The average price-to-earnings ratio varies widely by sector. For example, technology companies often have higher ratios due to rapid innovation and growth, while utilities usually maintain lower ratios given their stable earnings. Comparing a retailer’s ratio to a tech firm’s can be misleading, so always benchmark within the same industry.
For instance, retail giants like Target, Costco, and Walmart may each have different price-to-earnings ratios in 2026, reflecting their individual growth prospects and market positions. Sector trends, such as shifts brought by new technology or regulatory changes, can also alter what is considered a “normal” P/E.
Growth Rates and P/E
Fast-growing companies typically justify a higher price-to-earnings ratio. Investors are willing to pay more for anticipated future earnings. The PEG ratio, which divides the price-to-earnings ratio by the company’s earnings growth rate, offers deeper insight.
A tech stock with a price-to-earnings ratio of 30 but a 25 percent growth rate might still be considered attractive. The price-to-earnings ratio alone does not capture the full growth story, so always consider both metrics together.
Market Cycles and Macroeconomic Factors
Market cycles, interest rates, and inflation have a significant impact on the average price-to-earnings ratio across the market. During periods of low interest rates or economic optimism, ratios tend to rise as investors expect stronger earnings ahead.
In 2026, factors like the post-pandemic recovery, advances in artificial intelligence, and global economic shifts continue to influence how investors interpret the price-to-earnings ratio. Historical averages, such as the S&P 500’s typical range of 18 to 22, provide useful context for identifying broader market trends.
Red Flags and Misleading P/Es
A low price-to-earnings ratio might seem appealing, but it can also indicate declining sales, poor balance sheet quality, or other hidden risks. Conversely, a high ratio might mask vulnerabilities, such as overreliance on uncertain future earnings.
Watch out for these red flags:
- Sudden drops in earnings
- High debt levels distorting net income
- Significant one-time accounting items
Always use the price-to-earnings ratio as a starting point, not the final word, and support your analysis with a full review of a company’s fundamentals.
Benchmarking Against Indices
Benchmarking a company’s price-to-earnings ratio against broader indices like the S&P 500 helps investors determine relative value. For example, if a company trades at 16 times earnings while the sector average is 20, it could represent an opportunity or signal market concerns.
For up-to-date and historical reference points, investors can consult resources such as the S&P 500 P/E Ratio with Forward Estimate to better understand how current valuations compare to long-term trends. This context is vital for making sound investment choices in 2026.
Practical Applications: Using the P/E Ratio in 2026 Investment Decisions
Navigating the 2026 investment landscape requires practical tools and sharp analysis. The price-to-earnings ratio stands out as a key metric for investors aiming to make informed decisions. In this section, we explore hands-on strategies for using the price-to-earnings ratio to compare companies, assess trends, integrate with other metrics, and avoid common pitfalls in a rapidly changing market.

Comparing Companies and Sectors
The price-to-earnings ratio is a powerful tool for comparing companies within the same sector. For example, if a technology company reports a price-to-earnings ratio of 30 while a utility company posts a ratio of 15, these numbers reflect different growth expectations and risk profiles. Always compare P/E ratios among direct peers to ensure meaningful conclusions.
A simple table can help illustrate sector differences:
| Company | Sector | P/E Ratio |
|---|---|---|
| TechCo | Tech | 30 |
| PowerGrid | Utilities | 15 |
| RetailMart | Retail | 20 |
By benchmarking each company’s price-to-earnings ratio against sector averages and industry peers, investors can identify potential undervalued or overvalued stocks. This approach helps filter opportunities before diving deeper into financial statements.
Assessing Historical and Future Performance
Tracking a company’s price-to-earnings ratio over time reveals important trends. If a company’s ratio drops from 22 to 18 while earnings remain stable, this could indicate undervaluation or shifting market sentiment. Comparing current ratios to historical averages helps investors spot anomalies and signals for further research.
Forward-looking analysis also matters. A rising forward price-to-earnings ratio may reflect optimism about future earnings, while a declining ratio can signal caution. Monitoring these movements provides a clearer picture of market expectations in 2026.
Integrating P/E with Other Metrics
The price-to-earnings ratio should never be used in isolation. Combining it with other financial indicators, such as profit margin, debt levels, and revenue growth, offers a more holistic view of company performance. For example, a low P/E ratio paired with strong profit margins may suggest a true bargain, while the same ratio with shrinking margins could be a value trap.
Consider this checklist when evaluating stocks:
- Review the price-to-earnings ratio and profit margin together.
- Analyze debt-to-equity ratios for financial stability.
- Examine revenue and earnings growth rates.
This integrated approach reduces the risk of misinterpreting valuation signals.
Spotting Value and Growth Opportunities
Investors often look for undervalued gems or high-growth prospects using the price-to-earnings ratio. A low ratio, combined with solid fundamentals, may highlight a value stock poised for a rebound. Conversely, a high ratio can be justified for companies with rapid earnings growth and strong competitive positions.
However, be cautious. Sometimes a low price-to-earnings ratio is the result of industry challenges or company-specific issues. Always investigate the underlying reasons before making investment decisions. Use the ratio as a starting point, not the final word.
Real-World Case Studies (2026)
In 2026, several companies have demonstrated how the price-to-earnings ratio reflects market dynamics. For instance, a leading AI firm’s P/E soared after announcing breakthrough products, while a retail giant’s ratio fell despite stable profits due to industry headwinds.
Macroeconomic events also play a role. Market corrections can compress P/E ratios across sectors, while sector booms may inflate them. Analyzing these real-world shifts helps investors understand how the price-to-earnings ratio responds to both company performance and broader trends.
Limitations in Practical Use
The price-to-earnings ratio has notable limitations, especially for companies with negative earnings or those in early growth stages. In these cases, alternative metrics such as price-to-sales or EV/EBITDA become more relevant. The ratio also loses utility for cyclical or turnaround companies where earnings fluctuate widely.
Always remember that the price-to-earnings ratio is just one piece of the puzzle. Use it as part of a comprehensive analysis, regularly update your data, and adapt your strategy to changing market conditions for the most effective investment decisions.
Advanced Considerations and Limitations of the P/E Ratio
Understanding the price-to-earnings ratio in detail is crucial for investors seeking to make informed decisions in 2026. While this metric offers valuable insights, its interpretation is shaped by several advanced factors and inherent limitations. A nuanced approach is essential for accurate stock valuation.
Factors Influencing P/E Ratios
Several variables can affect the price-to-earnings ratio, making it important to look beyond the surface. The quality of reported earnings is a key element. Non-recurring items, such as asset sales or restructuring charges, can distort earnings and thus the ratio. Investors must examine whether net income reflects the company's core operations.
Capital structure is another significant factor. Companies with high debt may report lower net income due to interest expenses, which can inflate their price-to-earnings ratio compared to peers with less leverage.
Market sentiment also plays a role. During periods of optimism, investors may bid up share prices, resulting in higher price-to-earnings ratios even if fundamentals do not fully justify the valuation. Speculative bubbles in sectors like technology or biotech can lead to extreme ratios.
| Factor | Impact on P/E Ratio | Investor Consideration |
|---|---|---|
| Earnings Quality | One-time items distort EPS | Adjust for recurring earnings |
| Capital Structure | Debt lowers net income | Compare leverage among peers |
| Market Sentiment | Can inflate P/E | Assess if optimism is warranted |
Forward vs. Trailing P/E: Pros and Cons
When analyzing the price-to-earnings ratio, investors must decide between using trailing or forward data. The trailing P/E is based on the last four quarters of actual earnings, offering objectivity and verifiability. However, it may not reflect changes in the company's outlook or recent developments.
Forward P/E, on the other hand, uses analysts' estimates for the next 12 months. This makes it more forward-looking and relevant in dynamic sectors, especially in 2026 as innovation accelerates. Yet, forward P/E depends on projections, which can be overly optimistic or inaccurate.
In a rapidly changing market, many investors prefer forward P/E for its predictive value, but they should always review the assumptions behind the estimates. Comparing both ratios can reveal market expectations and highlight potential risks.
Inflation, Interest Rates, and Macro Trends
Macroeconomic factors have a profound impact on the price-to-earnings ratio. Rising inflation and higher interest rates tend to compress P/E multiples, as future earnings become less valuable in present terms. Historically, periods of low rates have supported higher ratios.
As of 2026, global economic shifts, technological advancements, and post-pandemic recovery continue to influence valuation norms. For example, according to Global Stock Market P/E & Valuation 2026, average P/E ratios across regions reflect both optimism in growth sectors and caution in more cyclical industries.
Investors should always contextualize P/E ratios within prevailing macro trends, adjusting expectations as economic conditions evolve. Awareness of these drivers helps avoid misinterpretation and supports better long-term decision making.
Limitations and Common Misconceptions
The price-to-earnings ratio is a powerful tool, but it is not infallible. One limitation is that it does not account for growth potential, risk profile, or capital structure differences. For example, two companies with identical ratios may have vastly different prospects due to their industry, management, or balance sheet strength.
A common misconception is that a low price-to-earnings ratio automatically signals a bargain. In reality, it may reflect declining business fundamentals or market skepticism about future performance. Conversely, a high ratio could be justified by strong growth expectations.
Investors must use the price-to-earnings ratio as part of a broader analysis, considering additional metrics, qualitative factors, and sector-specific dynamics. Overreliance on a single number can lead to costly mistakes.
When the P/E Ratio Fails
There are situations where the price-to-earnings ratio provides little or no insight. Companies with negative earnings, such as early-stage startups or those in turnaround phases, will have undefined or misleading ratios. Similarly, highly cyclical businesses may report volatile earnings, making the ratio unreliable across economic cycles.
In these cases, alternative metrics offer better guidance. For instance, the price-to-book ratio explained is useful for asset-heavy firms or when earnings are temporarily distorted. Other approaches include price-to-sales or enterprise value to EBITDA, which can provide a more stable view of valuation.
Understanding when to move beyond the price-to-earnings ratio ensures that investors do not overlook attractive opportunities or fall into common analytical traps.
Best Practices for 2026 Investors
To maximize the value of the price-to-earnings ratio, investors in 2026 should integrate it into a comprehensive analytical framework. Always update data regularly and adjust for extraordinary events that may impact earnings.
Stay informed about sector trends and macroeconomic indicators, as these can shift valuation benchmarks. Compare companies within peer groups, and avoid drawing conclusions from the price-to-earnings ratio in isolation.
Finally, combine quantitative analysis with qualitative insights, such as management quality and competitive position. By following these best practices, investors can use the price-to-earnings ratio more effectively and avoid the pitfalls that come with a narrow focus.
The P/E Ratio in a Broader Investment Strategy
Understanding the price-to-earnings ratio is essential for building a robust investment strategy in 2026. As investors seek to balance risk and reward, the price-to-earnings ratio acts as a foundation for evaluating stocks, comparing sectors, and making informed decisions. Let us explore how this ratio fits into a comprehensive investment approach.
Integrating P/E into Portfolio Management
The price-to-earnings ratio is a practical starting point for screening stocks. Investors often use it to filter out companies that do not meet their valuation criteria or to highlight potential bargains. However, relying solely on the price-to-earnings ratio can lead to missed opportunities or hidden risks.
A well-constructed portfolio includes stocks from various sectors, each with its own average price-to-earnings ratio. By considering sector norms, investors can diversify holdings and reduce exposure to single-industry volatility. Combining the price-to-earnings ratio with qualitative research and industry insights helps create a balanced, resilient investment mix.
P/E Ratio and Market Timing
Market-wide analysis of the price-to-earnings ratio can reveal whether stocks are generally undervalued or overvalued relative to historical norms. For example, comparing current averages to the S&P 500’s forward P/E can offer valuable context. Investors can consult the S&P 500 P/E Ratio Forward Estimate (Quarterly) to track projected earnings and gauge market sentiment.
During periods of economic expansion, the price-to-earnings ratio may climb as optimism grows. In downturns, it often contracts. Recognizing these patterns helps investors adjust their strategies, manage risk, and potentially capitalize on market cycles.
Educational and Research Tools for Investors
Modern investors have access to a wealth of tools for analyzing the price-to-earnings ratio. Real-time financial platforms provide up-to-date P/E data, historical trends, and peer comparisons. Interactive charting tools allow users to visualize how a stock’s price-to-earnings ratio moves over time or in response to earnings reports.
Artificial intelligence and data analytics further enhance research capabilities. By integrating these resources, investors gain deeper insight into valuation trends and make more precise investment choices based on the price-to-earnings ratio.
Common Mistakes to Avoid
A frequent mistake is overreliance on the price-to-earnings ratio without considering the bigger picture. Sector-specific factors, macroeconomic shifts, and one-off events can all distort the ratio’s meaning. Investors sometimes forget to adjust for non-recurring earnings or to benchmark against relevant industry averages.
Another pitfall is using outdated data or inconsistent sources. The price-to-earnings ratio must be calculated using reliable, current figures to ensure accurate analysis and avoid costly errors.
Continuous Learning and Adaptation
Markets evolve rapidly, and so must investment strategies. Staying updated on financial news, sector developments, and valuation trends is crucial for interpreting the price-to-earnings ratio effectively. Investors should regularly refine their approach, incorporating new research and learning from both successes and setbacks.
Understanding the nuances of the price-to-earnings ratio, such as why growth stocks may trade at higher multiples, helps investors adapt to changing market dynamics. For more on growth stocks and their valuation characteristics, see Growth stock characteristics.
Resources for Further Study
Long-term investment success relies on continuous education. Reputable financial education platforms, books on valuation, and online courses can deepen understanding of the price-to-earnings ratio. Leveraging these resources empowers investors to build confidence and skill, ensuring they remain agile and informed in the evolving landscape of 2026.
The price-to-earnings ratio, when integrated thoughtfully, becomes a powerful tool in a broader investment strategy. By combining data, context, and ongoing learning, investors can navigate markets with greater clarity and conviction.
Now that you have a solid understanding of how the price to earnings ratio can guide smarter investment choices in 2026, imagine what you could discover by exploring market history in more depth With Historic Financial News’s upcoming platform, you can dive into interactive charts, AI driven insights, and original news that put today’s numbers in meaningful context By joining our beta, you’ll help shape a tool designed to empower investors, students, and curious thinkers alike Ready to see how history can inform your next investment decision Join Our Beta