
Market Timing: Historical Lessons for Modern Investors
The pursuit of buying low and selling high represents one of investing's most alluring yet elusive goals. Market timing, the strategy of moving in and out of investments based on predictions of future price movements, has captivated investors for generations while simultaneously frustrating academics and practitioners alike. By examining historical market events and the outcomes of various timing attempts, we can better understand both the theoretical appeal and practical challenges of this approach. Through careful analysis of past market cycles, economic indicators, and investor behavior patterns, the historical record reveals crucial lessons about when market timing succeeds, when it fails, and what distinguishes the two outcomes.
The Historical Context of Market Timing Strategies
Market timing has existed as long as organized financial markets themselves, though its formalization as an investment strategy gained prominence during the twentieth century. Market timing represents the attempt to predict future market movements and adjust portfolio allocations accordingly, moving between asset classes or increasing cash positions before downturns.
The 1929 stock market crash provides one of history's most studied examples of market timing outcomes. Some investors famously exited positions in the months preceding October's collapse, preserving capital that others lost. Joseph Kennedy Sr., for instance, reportedly sold his holdings after receiving stock tips from a shoeshine boy, concluding that widespread market participation signaled an unsustainable bubble. This anecdote, whether entirely accurate or partially apocryphal, illustrates the pattern recognition that successful market timing requires.
Early Academic Research and Skepticism
The efficient market hypothesis, developed in the 1960s and 1970s, challenged the theoretical foundations of market timing. The efficient market hypothesis suggests that asset prices fully reflect all available information, making consistent outperformance through timing virtually impossible. This academic perspective created decades of debate between theoretical finance and practical investment management.
Research examining professional money managers' timing abilities generally supported the skeptical view. Studies found that most mutual fund managers failed to successfully time the market consistently, with their tactical allocation decisions often detracting from rather than adding to performance. The challenges of market timing include transaction costs, tax implications, and the psychological difficulty of making contrarian decisions.
Components and Indicators Used in Market Timing
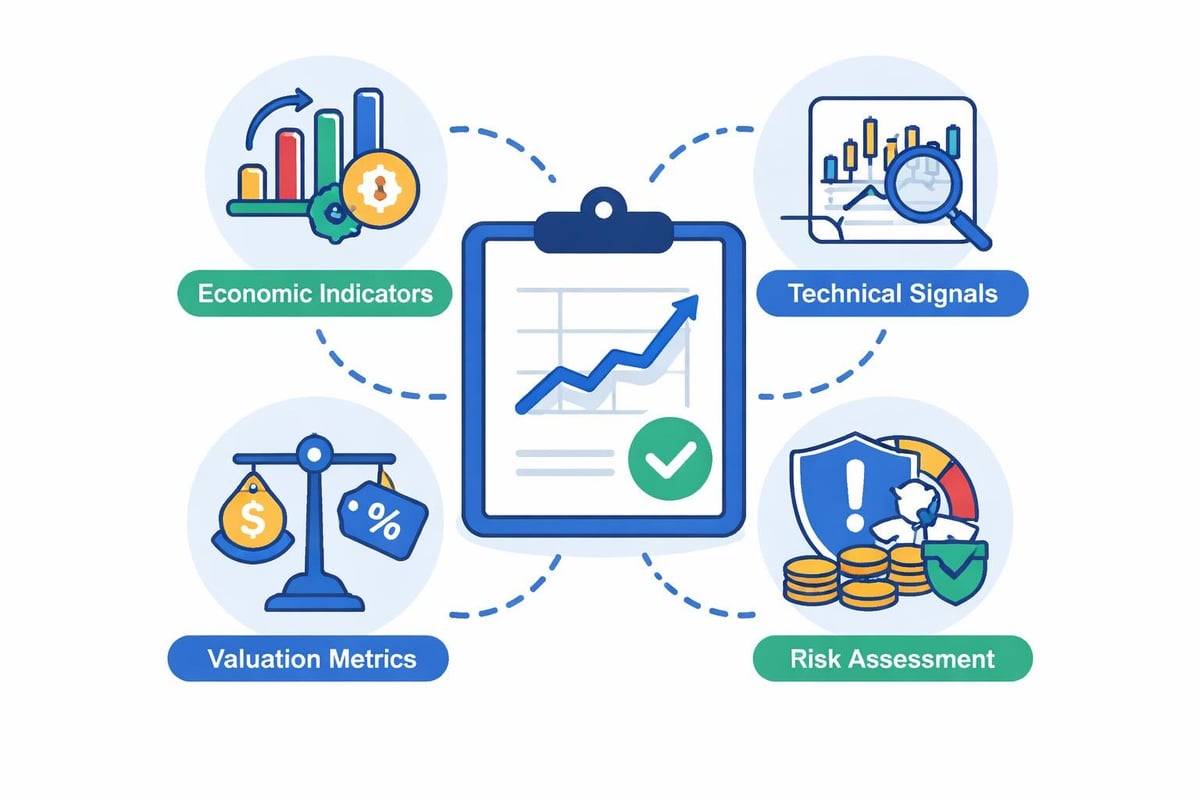
Successful market timing, when it occurs, typically relies on multiple information sources rather than single indicators. Historical analysis reveals that investors who accurately predicted major turning points often synthesized diverse data streams into coherent market narratives.
Economic Indicators:
- Interest rate trends and Federal Reserve policy changes
- Employment statistics and wage growth patterns
- Manufacturing activity and capacity utilization
- Consumer confidence and spending data
- Credit market conditions and lending standards
Valuation Metrics:
- Price-to-earnings ratios relative to historical averages
- Dividend yields compared to bond yields
- Market capitalization relative to GDP
- Corporate profit margins and sustainability
- Sector rotation patterns
Technical Indicators:
- Moving averages and trend identification
- Trading volume patterns
- Market breadth measurements
- Volatility indices
- Momentum oscillators
The 1987 crash illustrates how multiple warning signals can emerge simultaneously. In the months preceding October's 35% single-day decline, several indicators flashed warning signs: rising interest rates, elevated valuations, program trading concerns, and deteriorating market breadth. However, many investors ignored these signals, demonstrating that recognizing warnings differs from acting upon them.
The Role of Sentiment and Behavioral Factors
Historical market analysis reveals that sentiment extremes often coincide with major turning points. The late 1990s technology bubble showcased how euphoric investor sentiment can override traditional valuation concerns for extended periods. Companies with minimal revenue commanded billion-dollar valuations, while established corporations trading at reasonable multiples languished.
Conversely, the 2008-2009 financial crisis demonstrated extreme pessimism creating opportunities. With the S&P 500 down over 50% from its peak, credit markets frozen, and economic headlines uniformly negative, investors who added equity exposure in early 2009 captured exceptional subsequent returns. Understanding these historical market events requires examining not just price movements but the psychological and structural factors driving them.
Notable Historical Market Timing Successes
While consistent market timing proves difficult, history records several notable successes worth examining. These examples demonstrate that under certain conditions, with particular skill sets and informational advantages, investors have successfully navigated major market transitions.
| Time Period | Market Timer | Strategy | Outcome |
|---|---|---|---|
| 1929-1932 | Bernard Baruch | Gradual exit before crash, re-entry in 1932 | Preserved capital, captured recovery |
| 1987 | Paul Tudor Jones | Predicted October crash using technical analysis | Profited from decline |
| 1999-2000 | Stanley Druckenmiller | Reduced tech exposure early 2000 | Avoided significant losses |
| 2007-2009 | John Paulson | Shorted subprime mortgages | Generated billions in profits |
These successes share common characteristics: deep research, contrarian positioning, patience to wait for confirmation, and willingness to act decisively when conviction warranted. Importantly, each case involved months or years of preparation rather than impulsive reactions to short-term price movements.
The 1970s Inflation Hedge
The 1970s stagflation period presented challenges for traditional stock-bond portfolios but opportunities for investors who recognized changing economic dynamics. As inflation accelerated and the Federal Reserve's policies proved ineffective, investors who shifted allocations toward real assets, commodities, and inflation-protected securities outperformed those maintaining conventional portfolios.
This period illustrates sector timing rather than market timing. Rather than exiting equities entirely, sophisticated investors rotated into energy stocks, materials companies, and real estate while reducing exposure to long-duration bonds and growth stocks with distant cash flows. This nuanced approach proved more practical than attempting to time broad market entries and exits.
The Costs and Risks of Market Timing Attempts
Historical analysis reveals that unsuccessful market timing attempts often impose greater costs than simply accepting market volatility. Research on market timing effectiveness consistently demonstrates that missing the best-performing days significantly impacts long-term returns.
Between 1990 and 2020, missing the ten best trading days in the S&P 500 would have reduced a buy-and-hold investor's returns by approximately 50%. Since these best days often occur during volatile periods when market timers typically remain defensive, the practical challenge becomes evident. The 2008-2009 period exemplifies this pattern, with several of the decade's strongest rallies occurring amid continued economic deterioration.
Direct Costs of Market Timing:
- Transaction costs from increased trading frequency
- Tax implications of short-term capital gains
- Bid-ask spreads in less liquid markets
- Opportunity costs from holding excess cash
- Advisory fees for tactical strategies
Indirect Costs and Risks:
- Psychological stress from constant decision-making
- Increased likelihood of emotional reactions
- Portfolio whiplash from frequent changes
- Compounding effects of being wrong on both exits and re-entries
- Career risk for professional managers
The 2020 COVID-19 market crash perfectly illustrates timing challenges. The S&P 500 declined 34% in 33 days, the fastest bear market in history. Investors who sold during the panic avoided further declines but faced the impossible task of knowing when to re-enter. The subsequent recovery proved equally swift, with markets reaching new highs within months. Timing both the exit and re-entry correctly required near-perfect foresight.
Alternative Approaches: Rebalancing and Tactical Allocation
Recognizing the difficulties of pure market timing, many investors have adopted modified approaches that capture some potential benefits while avoiding extreme risks. Rebalancing investments represents one such middle ground, mechanically selling outperforming assets and buying underperforming ones to maintain target allocations.
Systematic Rebalancing as Disciplined Timing
Annual or quarterly rebalancing forces investors to "sell high and buy low" without requiring explicit market forecasts. During the late 1990s technology bubble, disciplined rebalancing would have systematically reduced technology exposure as valuations soared and increased holdings in undervalued value stocks. While missing the final stages of the bubble's ascent, this approach avoided catastrophic losses when the bubble burst.
The mechanical nature of rebalancing removes emotion from decisions while introducing modest countercyclical positioning. Historical backtests suggest that rebalancing added 0.5% to 1.0% annually to portfolio returns over multi-decade periods, though results vary by time frame and asset classes included.
Valuation-Based Tactical Shifts
Some investors employ valuation metrics to make modest tactical adjustments around strategic allocation targets. Rather than attempting to time major tops and bottoms, this approach shifts equity exposure within a defined range (perhaps 50% to 70%) based on metrics like the price-to-earnings ratio, cyclically adjusted P/E, or market cap-to-GDP ratios.
Historical analysis shows this approach would have reduced equity exposure during periods of extreme valuation like 1929, 1999-2000, and 2021 while increasing it during attractive entry points like 1932, 1982, and 2009. The key difference from pure market timing lies in graduated, modest adjustments rather than all-or-nothing positioning changes.
Lessons from Behavioral Finance and Market History
Modern behavioral finance research provides context for understanding why market timing proves so difficult despite its logical appeal. Psychological biases that served our ancestors well in evolutionary contexts work against optimal investment decisions in modern markets.
Cognitive Biases Affecting Market Timing:
- Recency bias: Overweighting recent events when forecasting futures
- Confirmation bias: Seeking information supporting pre-existing beliefs
- Loss aversion: Feeling losses more intensely than equivalent gains
- Overconfidence: Overestimating predictive abilities
- Herding: Following crowd behavior during extremes
The 2000 technology bubble demonstrates these biases in action. As valuations reached unprecedented levels, investors developed increasingly creative justifications for "new era" thinking. Traditional metrics like cash flow statements were dismissed as obsolete, replaced by measures like "eyeballs" and "mindshare." Selling during this euphoric period required fighting both quantitative signals and intense social pressure.
Pattern Recognition Versus Prediction
Historical market analysis reveals recurring patterns: credit bubbles followed by deleveraging, policy mistakes exacerbating downturns, innovations driving productivity growth. However, recognizing patterns differs fundamentally from predicting specific timing. The 2008 housing bubble provides a case study in this distinction.
Many analysts recognized unsustainable housing prices, deteriorating lending standards, and excessive leverage by 2005-2006. However, the bubble continued inflating for several more years, inflicting severe losses on investors who positioned for its collapse too early. As economist John Maynard Keynes observed, "Markets can remain irrational longer than you can remain solvent."

Modern Tools and Historical Data Analysis
Technology has dramatically increased retail investors' access to historical market data and analytical tools. Interactive charts, financial news coverage, and AI-powered analysis now provide insights previously available only to institutional investors. This democratization of information changes the market timing landscape in important ways.
Big Data and Machine Learning Applications
Modern market timing attempts increasingly incorporate machine learning algorithms trained on decades of historical data. These systems can process vast information streams, identifying subtle patterns that human analysts might miss. However, historical testing reveals significant limitations.
Market regimes change as regulations evolve, technologies advance, and economic structures transform. Patterns valid in the 1970s may not apply in the 2020s. The global equity market timing behavior of institutional investors has shifted as passive investing grew, potentially changing market dynamics in ways that invalidate historical relationships.
Furthermore, as more participants employ similar data-driven strategies, any exploitable patterns may disappear through arbitrage. This creates a moving target where yesterday's successful timing signals become tomorrow's crowded trades.
Distinguishing Market Timing from Strategic Positioning
Clear distinctions exist between market timing as typically practiced and strategic positioning based on long-term outlook. Understanding these differences helps investors develop appropriate expectations and approaches.
| Aspect | Market Timing | Strategic Positioning |
|---|---|---|
| Time Horizon | Days to months | Years to decades |
| Decision Frequency | Frequent adjustments | Infrequent major shifts |
| Information Used | Technical signals, sentiment | Fundamental valuations, secular trends |
| Risk Level | High (all-or-nothing) | Moderate (graduated changes) |
| Tax Efficiency | Poor (short-term gains) | Better (long-term capital gains) |
| Stress Level | Very high | Moderate |
Warren Buffett exemplifies strategic positioning rather than market timing. His approach involves identifying undervalued businesses with strong competitive advantages and holding them through market cycles. While he may increase buying during market panics, this reflects opportunistic value recognition rather than attempts to predict near-term price movements.
Understanding market timing through a historical lens reveals both its allure and its pitfalls, showing us that while perfect timing remains elusive, learning from past market cycles provides valuable perspective. By examining decades of market movements, investor behavior, and economic patterns, we gain context that pure theory cannot provide. Explore how Historic Financial News brings historical market data to life through interactive charts and AI-powered analysis, helping you understand the stories behind market movements and make more informed investment decisions based on lessons from the past.