
Laffer Curve: Tax Policy Theory and Market Impact
The laffer curve represents one of the most debated concepts in economic policy and fiscal theory. Named after economist Arthur Laffer, this theoretical relationship between tax rates and government revenue has influenced policy decisions across multiple decades and political administrations. Understanding this curve provides essential context for analyzing historical market movements, particularly during periods of significant tax reform. For investors, students, and analysts examining financial history, the laffer curve offers a framework for understanding how fiscal policy decisions ripple through markets and shape economic outcomes.
The Theoretical Foundation of the Laffer Curve
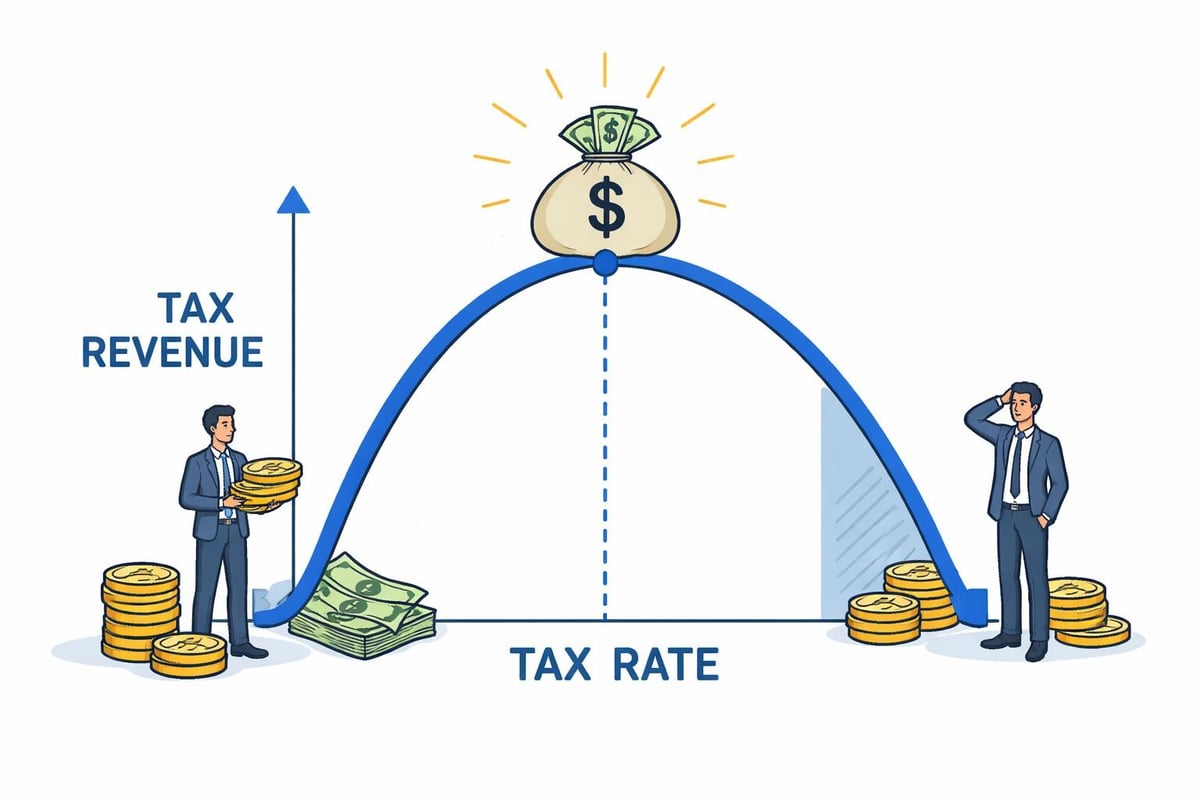
The laffer curve illustrates a fundamental economic principle: tax revenue does not increase indefinitely as tax rates rise. Instead, revenue follows a parabolic path, initially rising with higher rates before eventually declining. This counterintuitive relationship stems from the behavioral responses of taxpayers and economic actors to changing tax burdens.
The Laffer Center provides detailed analysis of how this curve operates in practice, demonstrating that two different tax rates can theoretically produce identical revenue. At a 0% tax rate, government revenue equals zero. Similarly, at a 100% tax rate, revenue also approaches zero because individuals have no incentive to earn taxable income. Between these extremes lies an optimal rate that maximizes revenue.
Key Components of the Theory
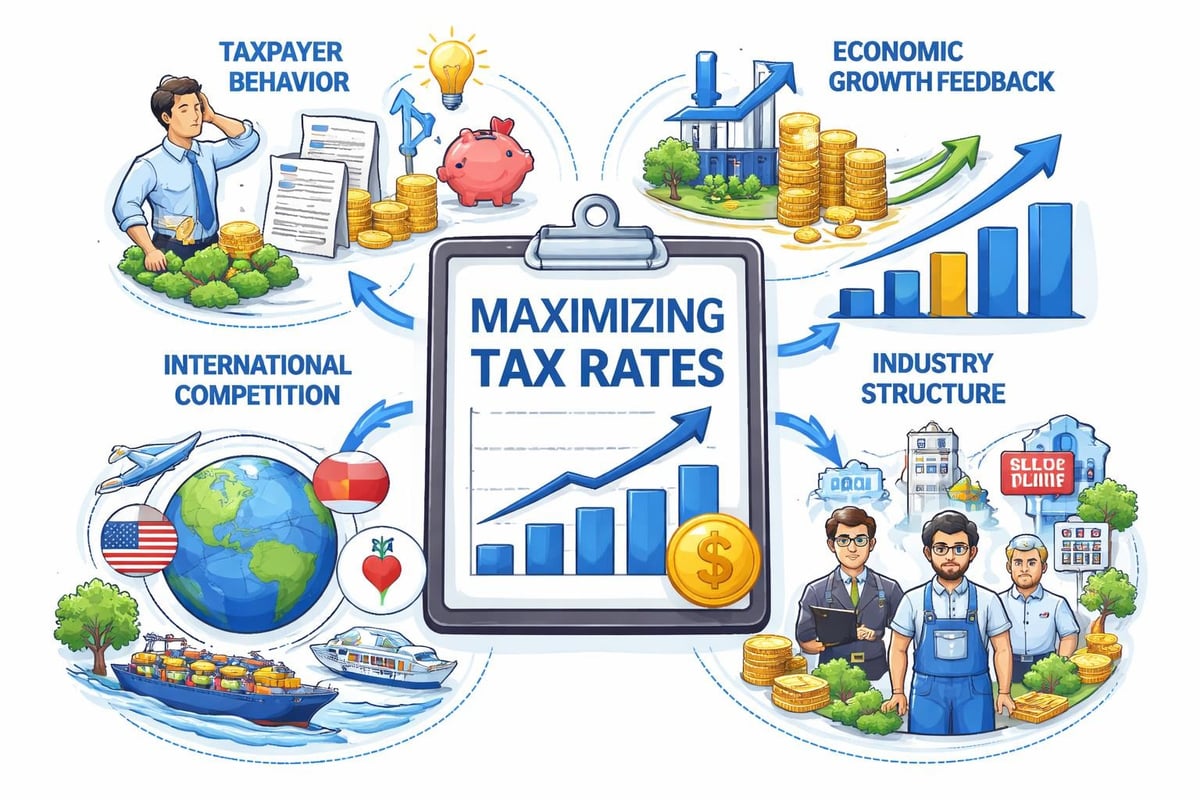
The curve's mechanics depend on several behavioral responses:
- Labor supply decisions: Workers may reduce hours or exit the workforce when facing higher marginal rates
- Investment allocation: Capital flows toward tax-advantaged activities or jurisdictions with lower rates
- Tax avoidance and evasion: Higher rates increase incentives for legal avoidance strategies and illegal evasion
- Economic growth effects: Tax policy influences overall economic expansion, which determines the tax base size
The shape and position of the laffer curve vary depending on the specific tax being analyzed. Corporate tax structures respond differently than individual income taxes, and consumption taxes create distinct behavioral patterns compared to capital gains levies.
Historical Applications and Policy Debates
The laffer curve gained prominence during the 1980s when supply-side economists advocated for significant tax cuts. The Reagan administration's 1981 Economic Recovery Tax Act reduced marginal income tax rates substantially, premised partly on the theory that lower rates would stimulate economic growth and potentially increase total revenue.
Historical data from this period provides mixed evidence. While the economy expanded significantly during the 1980s, federal revenue as a percentage of GDP remained relatively stable rather than increasing dramatically. Research from the Brookings Institution examining six decades of tax reform offers empirical perspective on whether rate reductions actually generated the predicted revenue increases.
Comparing Tax Reform Episodes
| Reform Period | Top Marginal Rate Change | Revenue Impact | Economic Context |
|---|---|---|---|
| 1964 Kennedy-Johnson | 91% to 70% | Revenue increased | Strong growth period |
| 1981 Reagan | 70% to 50% | Initially flat | Recovery from recession |
| 1986 Reagan | 50% to 28% | Revenue neutral by design | Stable expansion |
| 1993 Clinton | 31% to 39.6% | Revenue increased | Tech boom era |
| 2017 Trump | 39.6% to 37% | Revenue decreased initially | Late expansion |
These historical episodes demonstrate the complexity of isolating tax policy effects from broader economic conditions. Market reactions to tax legislation often reflected expectations about corporate earnings and competitive positioning rather than pure revenue mathematics.
Measuring the Revenue-Maximizing Rate
Determining where the peak of the laffer curve actually occurs remains a subject of intensive research and debate. Different methodologies, time periods, and economic conditions produce varying estimates of the revenue-maximizing tax rate.
CNBC's explanation of the curve highlights how this uncertainty complicates policy decisions. Estimating the optimal rate requires modeling taxpayer behavior, economic growth effects, and dynamic feedback mechanisms that change over time.
Empirical Challenges
Researchers face several obstacles when attempting to locate the curve's peak:
- Simultaneous causation: Tax rates affect economic growth, but growth also influences optimal tax rates
- Heterogeneous responses: Different income groups and industries react differently to rate changes
- International considerations: Global capital mobility creates competitive pressures absent from closed-economy models
- Time horizon effects: Short-term revenue impacts often differ from long-term equilibrium outcomes
Microeconomic Insights explores how market power and industry concentration affect the curve's properties, adding another layer of complexity to the analysis. Firms with significant market power may respond less elastically to tax changes than competitive industries.
Market Implications and Investor Considerations
For financial market participants, the laffer curve matters because tax policy directly affects asset valuations, investment returns, and capital allocation decisions. Changes in corporate tax rates alter after-tax profit margins, influencing stock prices. Modifications to capital gains taxes affect trading behavior and asset holding periods.
The 2017 Tax Cuts and Jobs Act provides a recent example. The legislation reduced the corporate tax rate from 35% to 21%, creating immediate valuation effects across equity markets. Small-cap stocks with predominantly domestic revenue exposure experienced different impacts than multinational corporations with complex international tax structures.
Sector-Specific Effects
Tax policy changes create winners and losers across market sectors:
- Financials: Benefit directly from lower rates due to limited ability to shift income internationally
- Technology: Large cash holders can repatriate offshore earnings under new structures
- Real estate: Pass-through entity provisions alter comparative advantages for different ownership structures
- Utilities: Regulated rate-of-return frameworks must adjust to new tax costs
Understanding these dynamics helps explain historical market movements during tax reform periods. Mid-cap stocks often show distinct performance patterns during such transitions, reflecting their particular sensitivity to domestic policy changes.
Dynamic Scoring and Revenue Estimation
When governments evaluate tax proposals, they must estimate revenue effects. Static scoring assumes no behavioral changes, while dynamic scoring attempts to incorporate growth feedback and taxpayer responses consistent with laffer curve theory.
The choice between methodologies significantly affects projected revenue impacts. Static analyses of rate reductions always show revenue losses, while dynamic models may project smaller losses or even gains if growth effects prove sufficiently strong.
| Scoring Method | Assumptions | Typical Revenue Estimate | Policy Implications |
|---|---|---|---|
| Static | No behavioral change | Direct proportional loss | Higher deficit projections |
| Partial Dynamic | Some growth effects | Reduced loss | Moderate deficit impact |
| Full Dynamic | Comprehensive feedback | Potentially neutral or positive | Low deficit concern |
Historical analysis reveals that actual outcomes often fall between static and fully dynamic projections. Operating margins typically improve following rate reductions, but economy-wide growth effects rarely prove large enough to fully offset the mechanical revenue reduction.
International Perspectives and Tax Competition
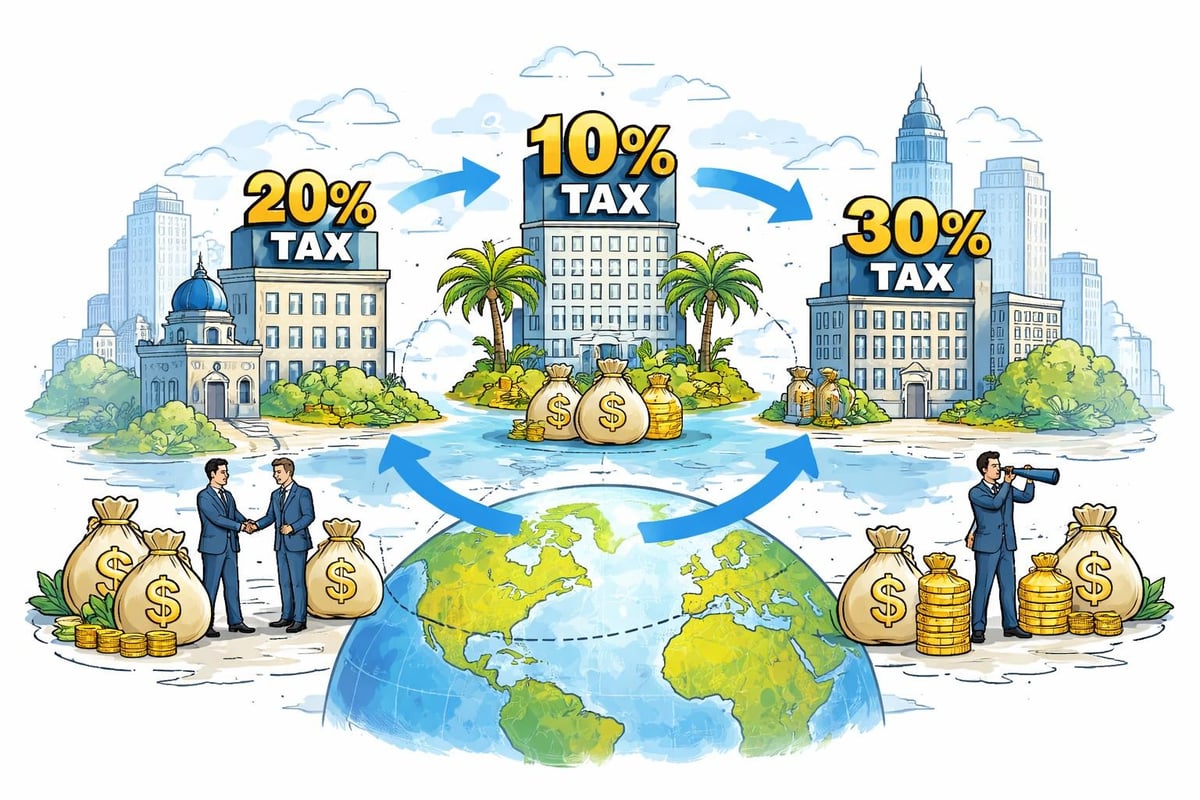
The laffer curve operates differently in a globalized economy where capital and even labor can relocate in response to tax differentials. Countries compete to attract investment and high-skilled workers, creating downward pressure on rates that might otherwise maximize revenue in a closed economy.
Ireland's corporate tax strategy exemplifies this dynamic. By maintaining a 12.5% rate, Ireland attracted substantial foreign direct investment despite foregoing potential revenue from higher rates. The strategy succeeds because mobile capital flows to favorable tax environments, expanding the tax base sufficiently to offset lower rates.
Corporate Inversions and Base Erosion
Tax competition manifests through several mechanisms:
- Corporate inversions relocating legal domiciles to lower-tax jurisdictions
- Transfer pricing strategies allocating profits to favorable tax environments
- Intellectual property migration concentrating valuable assets in low-tax locations
- Debt loading structures exploiting cross-border interest deduction opportunities
These behaviors suggest that for highly mobile tax bases, the revenue-maximizing rate sits considerably lower than for immobile factors. Understanding these mechanisms helps explain why developed nations have generally reduced corporate rates over recent decades despite rising government spending needs.
Behavioral Economics and Taxpayer Psychology
Recent research incorporates behavioral economics insights into laffer curve analysis. Taxpayers don't respond mechanically to rate changes; psychological factors influence decisions about work effort, risk-taking, and compliance.
Loss aversion creates asymmetric responses to rate increases versus decreases. Taxpayers may reduce economic activity more aggressively in response to rate hikes than they increase it following rate cuts. This behavioral pattern implies the curve may not be perfectly symmetric around its peak.
Similarly, fairness perceptions affect compliance. When taxpayers view rates as excessive or unfairly distributed, evasion increases beyond what purely economic models would predict. These psychological dimensions add nuance to revenue projections based purely on mathematical optimization.
Contemporary Relevance and Future Considerations
As of 2026, the laffer curve remains central to fiscal policy debates. Rising government debt levels create pressure to increase revenue, while global tax competition constrains rate increases. Policymakers must navigate these competing forces when designing sustainable tax systems.
Emerging trends complicate traditional laffer curve analysis:
- Digital economy taxation: How to tax borderless digital services challenges conventional frameworks
- Wealth versus income: Growing interest in wealth taxes introduces new curve dynamics
- Environmental taxation: Carbon taxes create different behavioral responses than traditional levies
- Cryptocurrency: Decentralized finance enables new tax avoidance mechanisms
Research continues to refine our understanding of how these factors reshape the relationship between rates and revenue. Modern economies feature greater complexity than the simple models underlying the original curve formulation.
The interaction between monetary and fiscal policy adds another dimension. When central banks maintain low interest rates, the revenue consequences of tax policy shifts differ from high-rate environments. Commercial paper markets and other funding mechanisms respond to the combined effect of tax and monetary conditions, creating feedback loops absent from traditional analysis.
Lessons from Economic History
Examining past tax regimes through the laffer curve lens reveals patterns that inform current policy debates. Post-World War II marginal rates exceeding 90% almost certainly placed the United States on the downward-sloping portion of the curve. Subsequent rate reductions likely increased economic efficiency even if they didn't always generate immediate revenue gains.
Conversely, the notion that all rate reductions generate revenue increases conflicts with empirical evidence. Historical episodes demonstrate that context matters: the economy's position relative to potential output, the specific tax being modified, and the starting rate level all influence outcomes.
Understanding these historical patterns helps market participants anticipate policy responses to fiscal challenges. When debt levels become unsustainable, governments eventually must either cut spending or raise revenue. Recognizing constraints imposed by the laffer curve helps predict which approaches policymakers will choose and how markets will react.
The laffer curve provides essential context for understanding the complex relationship between tax policy and economic outcomes. By examining how historical tax reforms influenced market performance and government revenue, investors and analysts gain valuable insights into fiscal policy dynamics. Historic Financial News empowers users to explore these connections through interactive charts and AI-powered analysis, helping you understand the stories behind market movements and learn from past policy experiments to make more informed decisions about future market trends.