
Profit Margin Guide: Mastering Profitability in 2026
In the rapidly shifting business landscape of 2026, understanding and optimizing profit margin is more crucial than ever for companies aiming to stay competitive. Economic fluctuations, rising competition, and constant technological innovations are transforming how organizations approach profitability.
Businesses today must be agile, as even minor changes in profit margin can mean the difference between thriving and merely surviving. Mastering this essential metric supports sustainable growth, effective risk management, and long-term success in any sector.
This article is designed as your comprehensive, actionable guide to profit margin. You will learn the fundamentals, step-by-step calculation methods, industry benchmarks, proven strategies for improvement, and the future trends shaping profitability in 2026.
By the end, you will be equipped to evaluate, optimize, and future-proof your company’s profit margin strategy with confidence.
Understanding Profit Margins: The Fundamentals
Profit margin is a foundational concept in business finance, representing the ratio of profit to revenue as a percentage. This metric shows how much profit a company retains from its sales after covering expenses. Unlike markup, which is based on cost, profit margin focuses on the proportion of profit relative to revenue. Many confuse the two, but understanding this difference is crucial for accurate financial analysis.
Consider a business that reports a 35 percent profit margin. This means it keeps $0.35 in profit for every dollar earned. High profit margin figures signal strong pricing power and effective cost management, while low margins often reveal greater risk and vulnerability to market shifts. The profit margin is not just a number for accountants—it is a key indicator for investors, lenders, and internal managers to evaluate operational efficiency and financial health.
Profit margin also differs from other performance metrics like rate of return or risk premiums, which measure profitability over time or in relation to risk. In practical terms, a company with a robust profit margin is typically better positioned to weather economic turbulence and invest in future growth. For context, industry competitors often see wide variations: for example, according to Average Profit Margin by Industry, manufacturing averages between 5 and 10 percent, while tech companies may exceed 20 percent. These benchmarks help businesses understand their position in the marketplace and set realistic targets.
Investors, lenders, and executives all rely on profit margin data to make informed decisions. Low profit margin values can be a warning sign of inefficiency or pricing challenges, while high margins reflect a company's ability to control costs and command premium pricing.
What is a Profit Margin?
Profit margin is calculated by dividing profit by total revenue and expressing the result as a percentage. This simple ratio gives immediate insight into how efficiently a company turns sales into actual profit. It is important to remember that profit margin is not the same as markup, which is based on cost rather than revenue.
For example, if a business generates $1,000,000 in sales and has $650,000 in total costs, its profit is $350,000. The profit margin would be:
profit_margin = (350000 / 1000000) * 100 # Result: 35%
This 35 percent profit margin means the company keeps $0.35 from every sales dollar. The metric is widely used by investors, lenders, and management teams to track financial health and compare performance against industry peers. Low profit margin values suggest tight pricing or high costs, while higher margins indicate strong control and market positioning.
Profit margin is often compared with metrics like rate of return and risk premiums, but it stands apart because it focuses on efficiency within a specific period. Industry standards vary, so benchmarking against sector averages is essential for context.
Types of Profit Margins
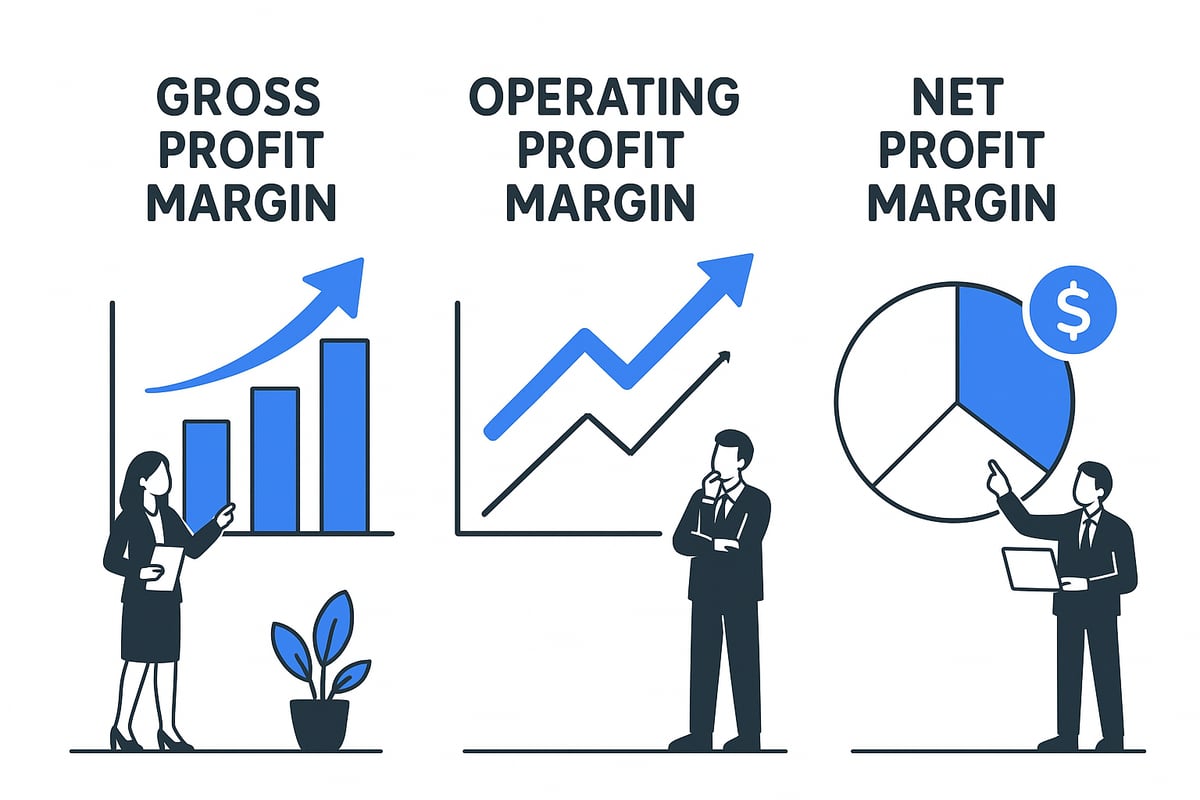
There are three primary types of profit margin every business should understand: gross, operating, and net.
Gross Profit Margin measures how much profit remains after subtracting the cost of goods sold (COGS) from revenue. The formula is:
gross_profit_margin = ((revenue - COGS) / revenue) * 100
Operating Profit Margin considers operating income, which deducts operating expenses from gross profit:
operating_profit_margin = (operating_income / revenue) * 100
Net Profit Margin reflects the bottom line, showing net income as a percentage of revenue:
net_profit_margin = (net_income / revenue) * 100
For example, if revenue is $1,000,000, COGS is $600,000, and operating expenses are $200,000, then:
- Gross profit margin: 40 percent
- Operating profit margin: 20 percent
- Net profit margin (assuming $150,000 net income): 15 percent
| Margin Type | Formula | Example Result (%) |
|---|---|---|
| Gross Profit Margin | (Revenue - COGS) / Revenue x 100 | 40 |
| Operating Margin | Operating Income / Revenue x 100 | 20 |
| Net Profit Margin | Net Income / Revenue x 100 | 15 |
Each profit margin type offers unique insights. Gross margin helps assess production efficiency, operating margin highlights core business strength, and net margin reveals overall profitability. Analyzing all three provides a complete financial picture and guides smarter decision-making for 2026.
Calculating Profit Margins: Step-by-Step Guide
Accurately calculating your profit margin is crucial for understanding your business’s financial health and making informed decisions. This section walks you through the practical steps to gather the right data, perform calculations, interpret results, and compare your numbers to industry standards.

Step 1: Gather Financial Data
Begin by collecting the necessary financial information. The most essential document for calculating profit margin is your income statement. This statement details your revenue, cost of goods sold (COGS), operating expenses, and net income. Ensuring the accuracy of these figures is fundamental, as even minor errors can distort your results.
For most businesses, you will need to pull revenue, COGS, operating income, and net income data. If you are unsure about where to find these figures, consult your income statement basics to get familiar with each line item.
For example, suppose your income statement reports $1,000,000 in revenue, $600,000 in COGS, $250,000 in operating expenses, and $100,000 in net income. These numbers form the basis for all profit margin calculations.
Step 2: Calculate Gross, Operating, and Net Profit Margins
With your financial data in hand, it is time to calculate each type of profit margin. Here are the essential formulas:
- Gross Profit Margin:
(Revenue - COGS) / Revenue x 100 - Operating Profit Margin:
(Operating Income) / Revenue x 100 - Net Profit Margin:
(Net Income) / Revenue x 100
Let us use the earlier example:
- Gross Profit Margin: ($1,000,000 - $600,000) / $1,000,000 x 100 = 40%
- Operating Profit Margin: $150,000 / $1,000,000 x 100 = 15% (where operating income is revenue minus COGS and operating expenses)
- Net Profit Margin: $100,000 / $1,000,000 x 100 = 10%
Avoid common mistakes such as omitting certain expenses or misclassifying revenue. Double-check figures to ensure your profit margin reflects reality.
Step 3: Interpret the Results
Once you have calculated each profit margin, it is important to understand what these numbers mean. A higher margin indicates stronger cost control and pricing power, while a lower margin may signal inefficiencies or increased competition.
For example, if your net profit margin is 10%, you keep $0.10 from every dollar of sales. A 50% margin, on the other hand, means half your revenue translates to profit. Watch for warning signs like declining margins over time. These may indicate rising costs, pricing pressures, or operational issues.
Use your profit margin data to guide strategic decisions, set performance targets, and forecast future profitability.
Step 4: Compare Against Industry Benchmarks
Benchmarking your profit margin against industry standards provides vital context. Use data from government reports, trade associations, or financial news sources to find average margins for your sector.
Suppose you run a retail business and discover the industry’s average net profit margin is 5%. If your margin is 10%, you are outperforming peers. If it is 2%, it may be time to review your pricing or cost structure.
Comparing your profit margin regularly helps you spot trends, identify strengths, and address weaknesses. Consistent benchmarking ensures your business remains competitive and resilient in 2026.
Industry Benchmarks and Sector Insights for 2026
Understanding how your profit margin compares to industry standards is essential for evaluating financial health and competitiveness. In 2026, sector-specific benchmarks offer valuable context for interpreting your own figures and identifying areas for improvement.
Profit Margin Benchmarks by Sector
Profit margin benchmarks vary widely between industries due to differences in cost structures, pricing power, and competition. For 2026, understanding these sector norms is crucial for setting realistic expectations and goals.
Here is a summary of average gross, operating, and net profit margins for key sectors:
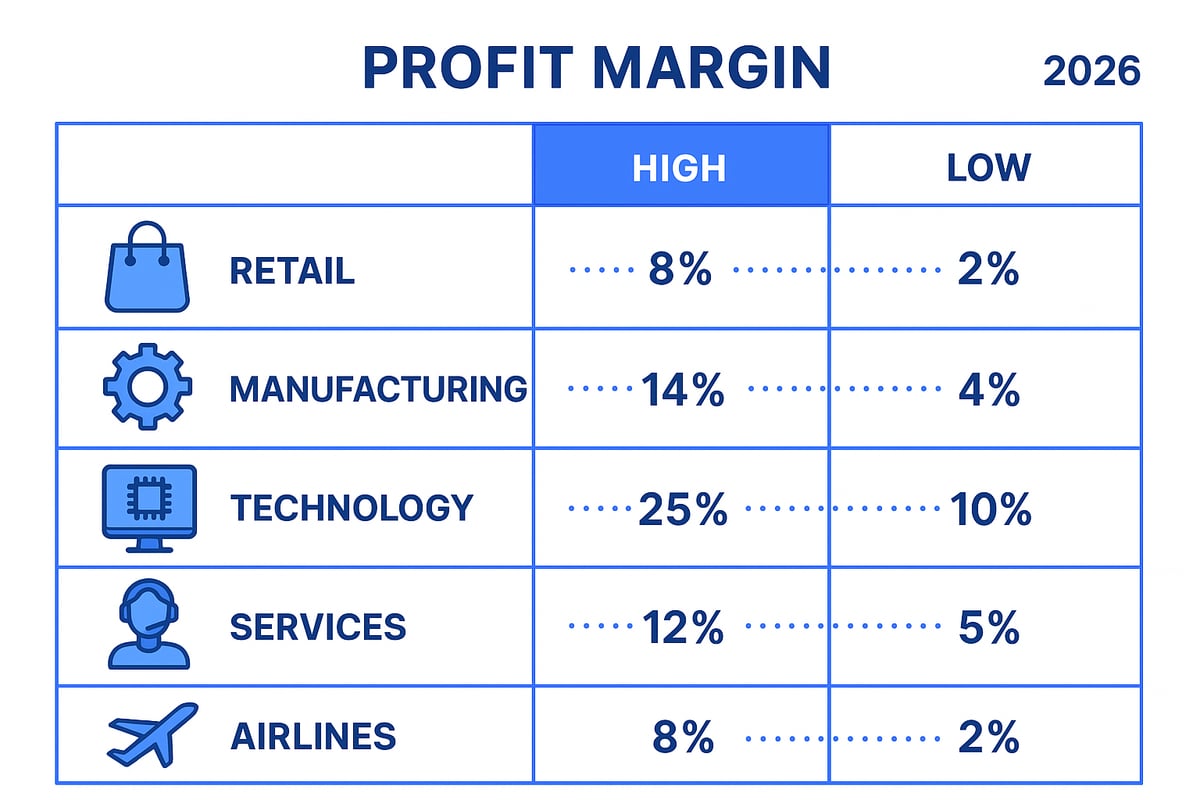
| Sector | Gross Margin | Operating Margin | Net Margin |
|---|---|---|---|
| Retail | 20-30% | 5-10% | 2-5% |
| Manufacturing | 25-35% | 8-12% | 5-10% |
| Technology | 40-60% | 20-30% | 15-25% |
| Services | 30-50% | 10-20% | 8-15% |
| Airlines | 12-18% | 5-7% | 3-5% |
For example, the airline industry is expected to stabilize with a 3.9% net margin in 2026, according to recent Airline Profitability Stabilizes with 3.9% Net Margin Expected in 2026 data.
Sector differences are shaped by several factors:
- Capital intensity impacts fixed costs and margin flexibility.
- Pricing power allows some industries, like technology, to achieve higher profit margin levels.
- Competitive pressures often compress profit margin in sectors such as retail and airlines.
Grocery stores typically operate on thin profit margin due to high competition and low pricing power, while software companies enjoy higher profit margin thanks to scalable products with minimal incremental cost.
Analyzing Variances and Outliers
Not every business fits neatly into its sector’s average profit margin. Outliers can occur for many reasons, and understanding these differences is key to benchmarking accurately.
Some companies consistently outperform sector averages by leveraging innovation, operational efficiency, or unique value propositions. For instance, a disruptor in the tech industry might maintain a 30% net profit margin, while legacy firms struggle with lower figures.
Conversely, businesses may underperform due to:
- Inefficient operations or outdated technology
- Poor cost control or supply chain issues
- Lack of differentiation in a crowded market
Consider a case study: a high-margin disruptor in retail may introduce a direct-to-consumer model, reducing costs and boosting profit margin, while traditional competitors face eroding margins. Analyzing these variances helps identify if your business is an outlier, and whether you’re outperforming or lagging behind.
To assess your position:
- Compare your profit margin directly with sector averages.
- Investigate reasons for significant variances.
- Look for sustainable advantages or risks in your business model.
Using Benchmarks for Strategic Decisions
Industry benchmarks are not just reference points, they are strategic tools for decision-making. Setting realistic profit margin targets requires a clear understanding of sector data and your own operational realities.
Investors and lenders routinely use profit margin benchmarks to evaluate risk and potential return. If your profit margin trails the industry, it may signal inefficiencies or pricing challenges that warrant attention. Conversely, significantly higher margins can attract investor interest but may also invite new competitors.
Practical applications of benchmarks include:
- Adjusting pricing strategies to align with sector norms
- Streamlining costs to close gaps with industry leaders
- Identifying opportunities for product or service innovation
For example, a retail company noticing its net profit margin below the sector average might review its cost structure or renegotiate supplier contracts to improve performance. Regularly benchmarking your profit margin ensures you stay agile and competitive as market conditions evolve.
Strategies to Improve Profit Margins in 2026
Profit margin optimization is essential for every business aiming for long-term resilience in 2026. With rapid market shifts, organizations must actively refine their approaches to revenue, cost, technology, and risk. Below, we break down practical strategies to elevate your profit margin this year.

Revenue Optimization Tactics
Revenue growth remains a cornerstone for boosting your profit margin. Start with advanced pricing strategies such as value-based pricing, which aligns price with perceived customer value, or dynamic pricing that responds to market demand in real time.
Bundling products or services can also increase average transaction size and improve your profit margin. For example, retailers often introduce private label products, which typically deliver higher margins than national brands.
Focusing on high-margin offerings within your sales mix is another proven approach. By analyzing product-level profitability, you can prioritize marketing and inventory toward items that most positively impact your profit margin.
For further actionable ideas, explore these 4 Ways to Improve Gross Profit Margin.
Cost Management and Operational Efficiency
Reducing costs is equally vital to improving profit margin. Begin by negotiating more favorable supplier contracts to lower the cost of goods sold. Consider optimizing inventory processes to minimize excess stock and associated holding costs.
Leverage technology to automate routine tasks, which can cut both labor and administrative expenses. For instance, a manufacturing company might automate production lines, resulting in significant labor savings and a healthier profit margin.
Outsourcing non-core functions, such as payroll or IT support, can also reduce fixed overhead. These tactics collectively enhance operational efficiency and contribute to sustained profit margin growth.
Leveraging Technology and Innovation
Technology is a major driver of profit margin improvement in 2026. Implementing AI and analytics enables smarter business decisions, from pricing adjustments to inventory management.
Digital transformation initiatives, such as cloud migration or process automation, streamline operations and reduce waste. For example, AI-powered demand forecasting tools help companies optimize pricing and stock levels, directly impacting the profit margin.
Regularly evaluating and adopting new digital tools ensures your business remains agile and competitive, supporting ongoing profit margin gains in a dynamic marketplace.
Risk Management and Margin Protection
Protecting your profit margin requires proactive risk management. Hedging strategies can stabilize input costs, especially in volatile markets. For businesses exposed to commodity price swings, forward contracts or futures can shield against sudden increases.
Diversifying revenue streams is another safeguard. Service firms, for example, may expand into digital products, which often carry higher margins and buffer against declines in traditional segments.
Evaluating customer and supplier concentration is also critical. Excessive reliance on a single source can expose your profit margin to sudden shocks, so aim for a balanced portfolio.
Monitoring and Continuous Improvement
Establishing a culture of regular review is key to sustaining profit margin improvements. Set up monthly margin review meetings, where teams analyze KPIs and promptly address negative trends.
Adopt dashboards and financial software to provide real-time visibility into margin performance. These tools allow for quick corrective actions, reducing the risk of margin erosion.
Continuous training and cross-functional collaboration further reinforce your organization's ability to adapt. The most successful businesses in 2026 will be those that treat profit margin management as an ongoing, company-wide priority.
Advanced Profit Margin Analysis and Forecasting for 2026
Mastering profit margin analysis is essential for staying competitive in the rapidly shifting 2026 business environment. Advanced techniques allow businesses to identify trends, anticipate challenges, and make informed decisions that protect and grow profitability.
Margin Trend Analysis
Tracking profit margin trends over time is crucial for uncovering both opportunities and risks. By analyzing historical data, leaders can identify upward or downward shifts that may signal deeper operational changes. One effective approach is the use of rolling 12-month averages, which smooth out seasonal fluctuations and reveal underlying patterns.
For example, a company experiencing a slow decline in profit margin over several quarters may be facing rising costs or increased competition. Early detection allows for proactive intervention, such as adjusting pricing or streamlining expenses.
Key warning signs to monitor include:
- Consistent drops in gross, operating, or net profit margin
- Increased volatility in monthly or quarterly results
- Divergence from industry benchmarks
Using tools that highlight trends helps management make timely strategic decisions. For a deeper dive into operating margin analysis, consider referencing Understanding Operating Margin for additional context.
Scenario Planning and Sensitivity Analysis
Scenario planning empowers companies to model how different variables impact profit margin. Sensitivity analysis, in particular, tests how changes in price, cost, or sales volume affect overall profitability.
Consider these common scenarios:
- What if raw material costs increase by 10 percent?
- How does a 5 percent price reduction influence profit margin?
- What is the impact of a sudden dip in sales volume?
By creating models for each scenario, businesses can assess potential risks and develop contingency plans. This process supports informed decision-making and helps prevent surprises that could erode profit margin.
Incorporating marginal cost analysis into your modeling, as outlined in Marginal Cost in Business, can refine sensitivity assessments and provide greater accuracy for forecasting.
Forecasting Margins in a Volatile Economy
Forecasting profit margin in 2026 means accounting for economic volatility. Fluctuations in inflation, supply chain disruptions, and regulatory changes can all impact future profitability.
Businesses should integrate macroeconomic indicators, such as inflation rates and currency fluctuations, into their forecasts. Leveraging predictive analytics and financial modeling software improves the accuracy of profit margin projections. For instance, a technology company anticipating new regulations can simulate their effect on costs and adjust forecasts accordingly.
Continuous monitoring and scenario updates ensure forecasts remain relevant as conditions evolve. This proactive approach positions businesses to respond effectively to market changes and protect their profit margin.
Common Pitfalls and How to Avoid Them
Even experienced analysts can fall into common traps when evaluating profit margin. Overlooking indirect costs, such as administrative overhead or distribution expenses, can lead to inflated margin estimates.
Other pitfalls include:
- Relying solely on historical data without considering future risks
- Neglecting to update models for changing business conditions
- Underestimating the impact of one-time or unexpected expenses
For example, a retailer might be caught off guard by a sudden increase in shipping costs, which sharply reduces profit margin. Regular reviews, comprehensive cost tracking, and scenario-based planning are essential for accurate analysis.
Avoiding these pitfalls ensures your profit margin analysis remains reliable and actionable as you navigate the complexities of 2026.
The Future of Profitability: Trends Shaping Profit Margins in 2026
As we look ahead to 2026, the business landscape is evolving rapidly. Organizations must adapt to new trends and external pressures to protect and grow their profit margin. Understanding these changes will be crucial for leaders seeking sustained profitability in an increasingly complex environment.
Emerging Technologies and Automation
Emerging technologies are reshaping how companies manage costs and scale operations. Automation, artificial intelligence, and cloud computing are streamlining workflows and eliminating inefficiencies. These tools help businesses improve their profit margin by reducing labor and operational costs.
For example, Software as a Service (SaaS) companies leverage automation to support scalable, high-margin growth. Robotics in manufacturing enables faster production cycles and fewer errors, leading to improved margins. Adopting digital tools is no longer optional for companies aiming to stay competitive and maintain a strong profit margin in 2026.
Shifting Consumer Expectations and Pricing Power
Consumers in 2026 demand more personalized, sustainable, and transparent products. Companies that align with these expectations often gain greater pricing power, positively impacting their profit margin.
Brands are increasingly able to charge premium prices for eco-friendly or customized offerings. This shift allows businesses to move beyond price competition and focus on value-based pricing. Listening to customer feedback and anticipating trends will be essential for protecting and enhancing profit margin as expectations continue to rise.
Global Economic and Regulatory Changes
Economic volatility and regulatory shifts can have significant effects on profit margin. Inflation, fluctuating interest rates, and new trade policies all influence input costs and pricing strategies.
Manufacturers, for instance, may need to adapt rapidly to new tariffs or supply chain disruptions. Staying agile and informed about global developments allows businesses to make proactive adjustments, minimizing negative impacts on profit margin. Predictive analytics can help forecast these changes and support better decision-making.
Competitive Dynamics and Market Disruption
Competitive pressures are intensifying as new entrants and digital-first companies disrupt traditional business models. These disruptors often operate with lower overhead and innovative approaches, squeezing the profit margin of established firms.
To respond, incumbents must rethink their value proposition and embrace innovation. Adopting flexible business models and investing in technology can help defend against margin pressure. Monitoring competitors and identifying opportunities for differentiation will be key in this dynamic environment.
Preparing Your Business for Margin Resilience
Building profit margin resilience requires a proactive, data-driven strategy. Organizations should invest in cross-functional teams, real-time analytics, and flexible cost structures. Regularly reviewing financial performance, setting clear goals, and acting quickly on insights can make a significant difference.
For actionable guidance, explore 4 Tips For Strategic Growth And Increased Profits In 2026, which offers strategies to future-proof your profit margin. By staying agile and informed, businesses will be well-positioned for long-term profitability.
As you’ve seen throughout this guide, understanding and optimizing profit margins isn’t just about crunching numbers—it’s about building a resilient, future-ready business strategy. By learning from the past and using practical tools like interactive charts and AI-powered insights, you can spot patterns, benchmark effectively, and set your business up for profitability in 2026 and beyond. If you’re passionate about exploring the financial stories that shape markets and want to be part of a new way to analyze profitability, Join Our Beta and help us bring historical context to your financial journey.