
Operating Income Guide: Mastering Profit Analysis in 2025
Are you truly unlocking your business’s full potential with operating income?
In 2025, understanding and mastering operating income is essential for making smarter, more profitable decisions. This guide breaks down what operating income means, why it matters, and how you can use it to analyze and optimize your company’s profitability.
You will discover clear definitions, step-by-step calculation methods, the latest trends, practical tools, and proven strategies to maximize your results. Ready to elevate your financial analysis and strategic planning? Let’s get started.
Understanding Operating Income: Definition, Scope, and Importance
Unlocking the full potential of operating income begins with a clear understanding of what this metric represents, how it is calculated, and why it matters. In today’s business world, knowing the ins and outs of operating income is essential for accurate profit analysis and smarter decision-making.
What Is Operating Income?
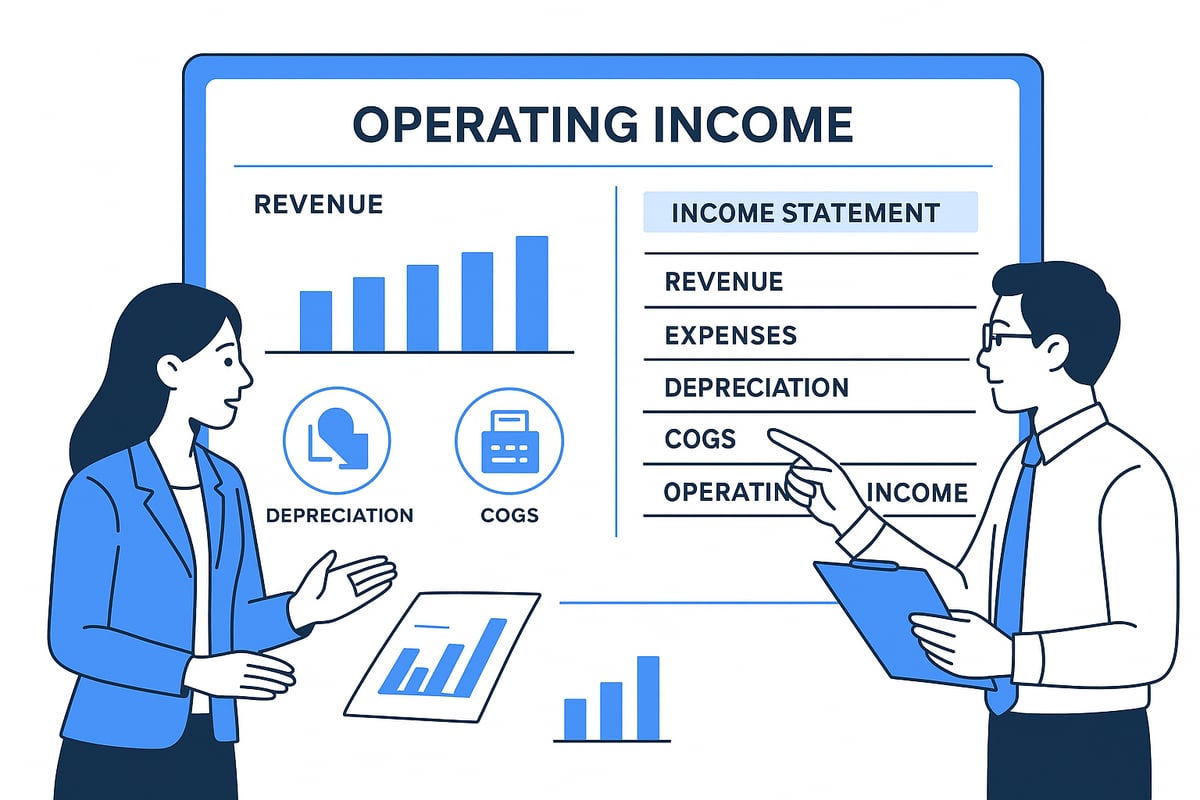
Operating income is the profit a business generates from its core operations after deducting operating expenses and depreciation. It is calculated using data from the income statement, focusing on revenue, cost of goods sold (COGS), operating expenses, and depreciation or amortization. Unlike net income, which includes interest and taxes, or EBITDA, which excludes depreciation and amortization, operating income offers a focused look at operational performance. For example, a manufacturing firm may report high operating income by efficiently managing production costs, while a tech company might see strong results due to low overhead and recurring revenue. Importantly, operating income excludes non-operating items, making it a trusted measure for investors and management to assess core profitability.
Why Operating Income Matters in 2025
In 2025, operating income stands out as a crucial indicator of operational efficiency and core profitability. It is a key figure in financial reporting, required for compliance and transparency. With ongoing market volatility and economic uncertainty, stakeholders rely on operating income to benchmark performance and analyze trends across periods. For instance, during economic downturns, a stable or rising operating income can signal resilient business health, even when revenues fluctuate. Companies use this metric to compare themselves against industry peers and to set strategic goals. As financial landscapes evolve, understanding operating income helps organizations adapt and thrive in unpredictable conditions.
Operating Income vs. Other Profitability Metrics
Comparing operating income with other profitability metrics reveals important differences in calculation and interpretation. Net income includes all revenues and expenses, even those unrelated to core operations. EBIT (Earnings Before Interest and Taxes) is similar but may include some non-operating items. EBITDA further excludes depreciation and amortization, offering a less conservative view of profitability. Gross profit, meanwhile, only subtracts COGS from revenue, ignoring other expenses. The table below summarizes these distinctions:
| Metric | Includes Non-Operating Items? | Includes Depreciation/Amortization? | Best Used For |
|---|---|---|---|
| Gross Profit | No | N/A | Production efficiency |
| Operating Income | No | Yes | Core operational analysis |
| EBIT | Sometimes | Yes | Broader profitability |
| EBITDA | Sometimes | No | Cash flow comparison |
| Net Income | Yes | Yes | Overall business health |
Relying solely on net income can be misleading if non-operating factors distort results. In contrast, operating income gives a more reliable view of ongoing business performance.
Limitations and Considerations
While operating income is powerful, it has limitations. It does not account for non-operating items or one-time charges, which can impact overall profitability. Different industries may categorize expenses differently, causing variations in reported operating income. Accounting choices, such as depreciation methods, can also influence the figure and potentially allow for manipulation. Therefore, it is vital to analyze operating income within context, considering industry norms and historical trends. Careful interpretation ensures that decisions are based on a true understanding of business operations and financial health.
Calculating Operating Income: Step-by-Step Guide for 2025
Unlocking the true profit potential of your business starts with a clear understanding of how to calculate operating income. This step-by-step guide will help you navigate the process, ensuring accuracy, clarity, and actionable insights for 2025.
The Operating Income Formula
Calculating operating income begins with a simple yet powerful formula. Operating income is the profit left after subtracting all operating expenses and depreciation from gross income. This metric reflects the core profitability of day-to-day business activities, excluding interest, taxes, and non-operating items.
Here is the standard formula:
| Component | Description |
|---|---|
| Gross Income | Revenue minus Cost of Goods Sold (COGS) |
| Operating Expenses | Salaries, rent, utilities, etc. |
| Depreciation | Allocation of asset costs over time |
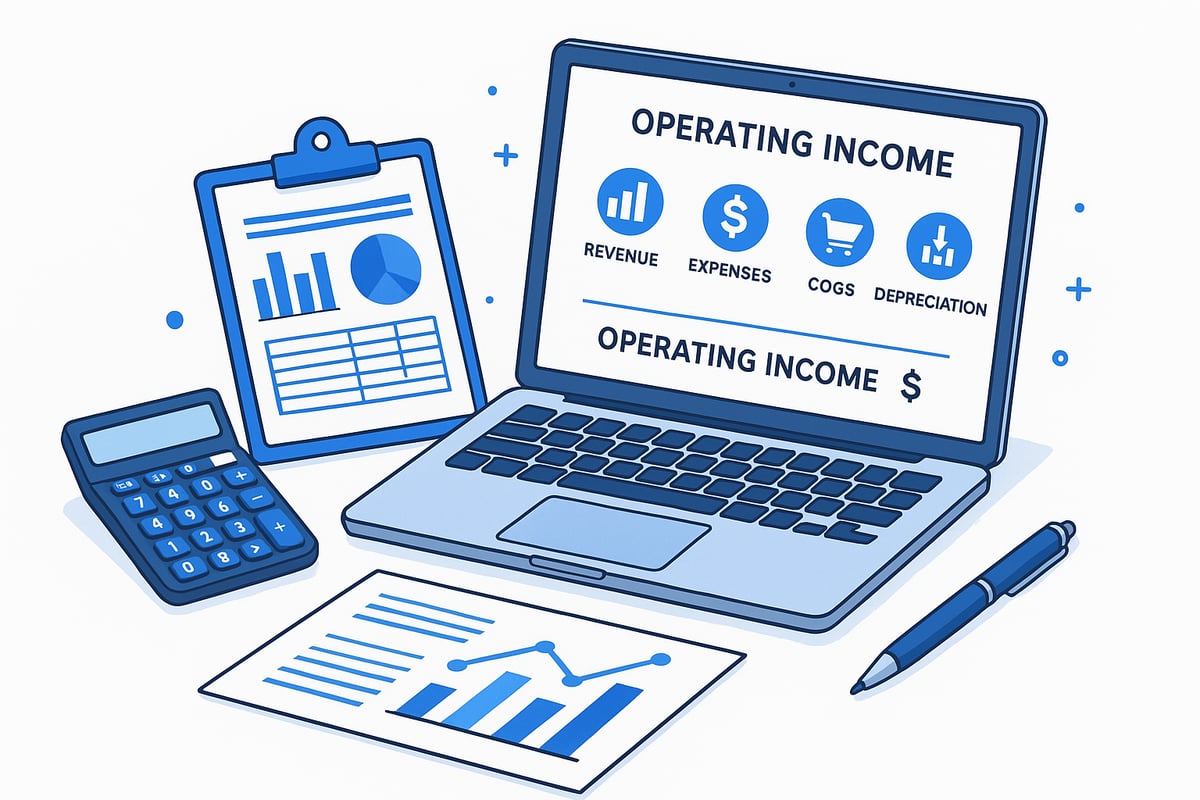
Formula:Operating Income = Gross Income - (Operating Expenses + Depreciation)
For example, if your gross income is $500,000, operating expenses are $200,000, and depreciation is $25,000, then:
Operating Income = $500,000 - ($200,000 + $25,000) = $275,000
Understanding each component ensures your operating income calculation is both accurate and meaningful.
Step 1: Gather Relevant Financial Data
Before you begin, collect all necessary financial data from your income statements. Focus on the core elements: total revenue, cost of goods sold, operating expenses, and depreciation or amortization figures.
Differentiate between operating and non-operating revenues and expenses. Operating items are directly related to your main business activities, while non-operating items include things like investment gains or losses.
Tips for accuracy:
- Double-check figures for completeness.
- Ensure all data is from the same reporting period.
- Use consistent accounting methods.
Accurate data collection is the foundation for a reliable operating income calculation.
Step 2: Calculate Gross Income
The next step is to determine gross income. Use the formula:
Gross Income = Revenue - Cost of Goods Sold (COGS)
COGS includes all direct costs of producing goods or services, such as raw materials, direct labor, and manufacturing overhead. For example, COGS as a percentage of revenue may vary—retail often ranges from 60% to 70%, while tech companies may see lower COGS ratios.
For a deeper look at gross profit and COGS fundamentals, see Gross income and COGS basics.
Accurately calculating gross income is essential, as it serves as the starting point for determining operating income.
Step 3: Deduct Operating Expenses and Depreciation
With gross income calculated, subtract all operating expenses and depreciation. Typical operating expenses include:
- Rent and lease payments
- Salaries and wages
- Utilities and office supplies
- Marketing and advertising
Depreciation and amortization reflect the gradual allocation of long-term asset costs. For example, a company may depreciate machinery over several years, spreading the cost across each period.
Categorize each expense carefully to avoid skewing your operating income results.
Step 4: Analyze and Interpret the Result
Once you have your operating income figure, evaluate what it reveals about your business performance. A higher operating income signals strong operational efficiency, while a declining figure may indicate rising costs or stagnating revenue.
Compare your results year-over-year to identify trends. For instance, if operating income rose from $250,000 to $275,000, it suggests improved profitability.
Trend analysis helps you spot strengths, address weaknesses, and make informed decisions for future growth.
Operating Income Trends, Benchmarks, and Industry Insights for 2025
Understanding operating income trends is essential for accurate profit analysis in 2025. As businesses navigate a rapidly changing financial landscape, keeping a close eye on industry benchmarks, historical data, and global variations can help leaders make informed strategic decisions. Let us examine the key factors shaping operating income this year.
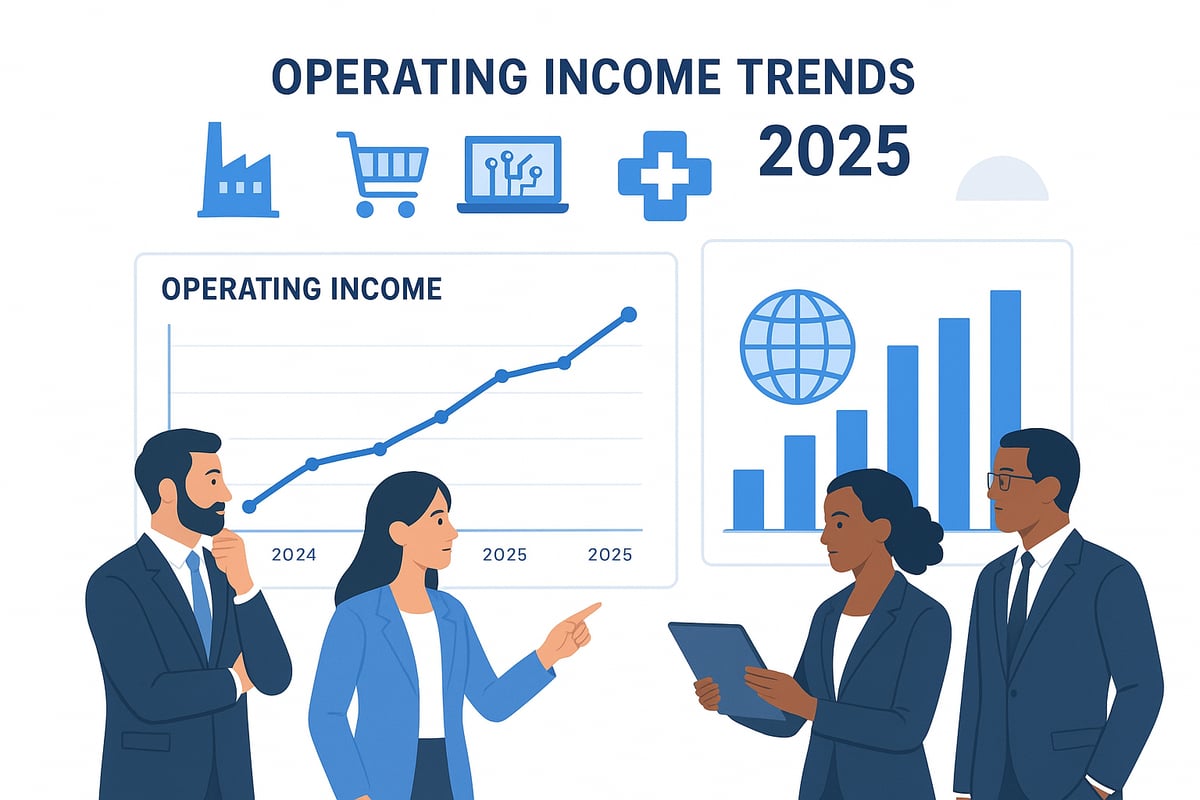
Current Trends Impacting Operating Income
In 2025, automation and AI are reshaping operating income by streamlining processes and reducing manual tasks. Companies are investing in digital transformation, which lowers some operating expenses but may increase technology costs upfront. Shifts in global supply chains and evolving labor markets also play a role, directly affecting cost structures.
Rising energy prices and ongoing geopolitical tensions are increasing input costs for manufacturers. Meanwhile, service and tech sectors are leveraging cloud platforms to enhance efficiency. According to recent industry forecasts, operating margins are expected to fluctuate, reflecting these dynamic changes in expense and revenue streams.
Industry Benchmarks: What’s a “Good” Operating Income?
Benchmarks for operating income vary widely by sector. For example, technology companies often report higher margins compared to retail or manufacturing. Here is a comparison:
| Industry | Average Operating Margin (%) |
|---|---|
| Technology | 20-30 |
| Retail | 3-8 |
| Manufacturing | 10-15 |
| Services | 12-18 |
Factors such as capital intensity, pricing power, and competition influence these differences. For a deeper understanding of how these margins relate to profitability, see Operating margin explained. Monitoring benchmarks helps companies set realistic targets for operating income.
Analyzing Historical Data for Strategic Insights
Reviewing historical operating income data is vital for spotting trends and forecasting future performance. Multi-year analysis reveals how companies respond to economic cycles, regulatory changes, and market disruptions. For instance, many businesses saw a decline in operating income during the pandemic, followed by a gradual rebound.
Comparing pre- and post-pandemic figures highlights resilience and adaptability. Organizations that monitor historical patterns can better anticipate shifts and adjust strategies. Continuous tracking of operating income allows leaders to identify emerging strengths or vulnerabilities before they impact overall profitability.
Global and Regional Variations
Operating income norms differ across regions due to regulatory environments, taxation, and local market dynamics. For example, US firms may report higher operating income than their European counterparts, partly because of different expense classifications and disclosure rules.
Tax policies and labor regulations also affect how operating income is calculated and reported. In Asia, rapid economic growth can drive higher operating margins in some sectors. Understanding these global and regional differences ensures accurate benchmarking and helps avoid misinterpretation of financial performance.
Common Pitfalls and Red Flags
There are several warning signs that may indicate trouble with operating income. Declining figures over multiple quarters, rising operating expenses without corresponding revenue growth, or flat revenues are all red flags. Sometimes, unusual spikes or drops may signal accounting anomalies or operational inefficiencies.
For example, a sudden increase in operating income could result from one-time cost reductions rather than sustainable improvements. Regular review and comparison with industry peers help detect these issues early. Staying vigilant allows management to address underlying problems and protect long-term profitability.
Tools, Software, and Best Practices for Operating Income Analysis
Mastering operating income analysis in 2025 requires not only a keen understanding of financial concepts but also the right tools and disciplined best practices. As financial data grows more complex, leveraging advanced software and a structured approach can unlock deeper insights and drive better business decisions.

Essential Tools and Financial Software for 2025
Selecting the right financial software is critical for accurate operating income analysis. Leading platforms such as Sage, QuickBooks, and NetSuite have evolved to offer automation, real-time reporting, and scenario analysis, all of which streamline data management.
Key features to prioritize include:
- Automated data capture and reconciliation
- Customizable templates for operating income reports
- Real-time dashboards and alerts
- Scenario modeling for stress-testing assumptions
Cloud-based solutions, in particular, allow for seamless collaboration and access to data from anywhere. As expense management becomes a focal point, insights from Operating costs in 2025: Lessons from 2024 highlight how integrating these tools helps organizations adapt quickly to shifting cost structures and protect operating income margins.
Setting Up Effective Operating Income Dashboards
Dashboards transform raw data into meaningful insights by visualizing key metrics related to operating income. An effective dashboard should be tailored to the needs of different stakeholders, such as CFOs or department heads.
Essential metrics to include:
- Revenue and COGS trends
- Operating expenses by category
- Depreciation and amortization breakdown
- Period-over-period operating income comparisons
| Metric | Visualization Type | Stakeholder Focus |
|---|---|---|
| Operating Income Trend | Line Chart | CFO, Executives |
| Expense Breakdown | Pie Chart | Department Heads |
| Revenue vs. COGS | Bar Graph | Finance Analysts |
Customizing the layout and level of detail ensures that each team member can focus on the numbers that matter most to them.
Integrating Operating Income Analysis with Broader Financial Planning
To maximize the value of operating income analysis, it must be integrated with overall financial planning. Linking operating income to budgets, forecasts, and strategic plans enables organizations to allocate resources more effectively.
Scenario planning is especially vital in today’s environment. By running sensitivity analyses, teams can predict how changes in costs or revenues will impact operating income and, by extension, overall business performance.
For example, companies often use rolling forecasts based on operating income trends to adjust their strategies proactively. This integration helps bridge the gap between day-to-day operations and long-term objectives.
Ensuring Data Integrity and Consistency
Accurate operating income analysis relies on clean, consistent data. Best practices for financial data management include strong internal controls, regular audits, and clear documentation of expense categorization rules.
Tips for maintaining data integrity:
- Establish standardized account codes and categories
- Conduct periodic reconciliations and variance analyses
- Implement audit trails within financial software
These practices help prevent errors, such as misclassifying non-operating expenses as operating, which could distort operating income figures. Consistent processes build trust in the numbers and improve decision-making.
Training Teams and Building Financial Literacy
A cross-functional understanding of operating income is essential for company-wide success. Training programs should cover key concepts, calculation methods, and the strategic implications of this metric.
Effective initiatives include:
- Workshops on interpreting dashboards and financial reports
- E-learning modules for non-financial staff
- Regular review sessions to discuss performance trends
By equipping teams with the skills to analyze and act on operating income data, organizations foster a culture of accountability and continuous improvement.
Strategies to Optimize and Leverage Operating Income in 2025
Unlocking higher operating income is a strategic imperative for businesses aiming to thrive in 2025. By understanding the key drivers, applying targeted cost and revenue tactics, adapting to market shifts, and connecting these efforts to long-term value, organizations can turn this metric into a powerful lever for growth and resilience.
Identifying Key Drivers of Operating Income
The primary drivers of operating income include revenue growth, pricing power, cost efficiency, and process optimization. Each industry will have its unique mix, but the fundamentals remain consistent.
- Revenue growth: Expanding sales or entering new markets increases the top line.
- Pricing strategies: Adjusting prices to reflect value or cost changes can boost margins.
- Cost control: Managing expenses directly impacts profitability.
- Process improvements: Streamlining workflows reduces waste and errors.
For example, a manufacturer that optimizes its supply chain can see a direct improvement in operating income by lowering procurement and logistics costs. In the health insurance sector, as highlighted in Health insurer financial insights Q1 2025, careful claims management and digital transformation have emerged as key drivers.
Cost Management and Expense Reduction Tactics
Effective cost management is essential for maximizing operating income without sacrificing growth. Start by identifying areas with the greatest savings potential:
- Outsourcing non-core activities to specialized providers
- Automating repetitive tasks to reduce labor costs
- Renegotiating supplier contracts for better terms
- Implementing energy-efficient solutions to cut utility expenses
A retailer, for instance, might reduce utility costs by upgrading to LED lighting and smart thermostats, directly increasing operating income. Regularly reviewing expense categories and benchmarking against peers helps ensure spending is aligned with industry standards. This proactive approach keeps margins healthy and supports sustainable growth.
Revenue Enhancement Strategies
Revenue enhancement is a powerful lever for improving operating income. Companies can pursue several initiatives to drive top-line growth:
- Diversifying product or service offerings to reach new customer segments
- Introducing upselling and cross-selling programs to increase average transaction value
- Launching new products based on customer feedback and market trends
- Adopting tiered pricing models to capture more value from premium features
For example, a SaaS company that introduces a premium tier can see an immediate boost in operating income as recurring revenues increase. According to industry studies, even modest revenue growth can have a significant impact on operating income due to the fixed nature of certain operating costs.
Monitoring and Adjusting for Market Conditions
Adapting to changing market conditions is crucial for safeguarding operating income. Economic downturns, supply chain disruptions, or demand fluctuations require agile decision-making.
- Monitor key performance indicators in real time
- Adjust production or staffing levels to match demand
- Revisit pricing and promotional strategies as needed
Staying informed about financial trends in 2025 enables leaders to anticipate volatility and conduct scenario analyses. For example, a manufacturer might temporarily scale back production during a downturn, preserving cash flow and stabilizing operating income.
Linking Operating Income to Long-Term Business Value
Operating income is a key indicator for investors and acquirers, directly impacting company valuations and strategic decisions. Strong, consistent operating income signals operational health and resilience.
- Use operating income trends to inform valuation models
- Communicate results transparently to stakeholders
- Leverage healthy operating income to secure financing or attract investment
Private equity firms, for example, often prioritize operating income when assessing acquisition targets, as it reflects the underlying profitability of the core business. By focusing on this metric, organizations can build a foundation for long-term value creation and sustainable growth.
Using Operating Income for Forecasting, Decision-Making, and Growth
Understanding how to leverage operating income is essential for any business seeking sustainable growth in 2025. From forecasting to strategic planning, this metric provides a foundation for robust financial management. Let’s explore how operating income can power better decisions and drive value across your organization.
Operating Income in Financial Forecasting Models
Operating income plays a pivotal role in building accurate financial forecasts. By incorporating this metric into budgeting and scenario analysis, companies can anticipate future cash flows and profitability with greater precision.
To begin, gather historical operating income data and identify trends or seasonality patterns. Incorporate these insights into rolling forecasts to adjust projections as new information emerges. This approach helps businesses allocate resources more effectively and prepare for market changes.
Using operating income in forecasting also supports stress testing, enabling leaders to model best-case and worst-case scenarios. The result is a more resilient financial plan that adapts to uncertainty.
Decision-Making: When and How to Rely on Operating Income
Strategic decisions often hinge on a clear understanding of operating income. Whether evaluating expansion opportunities, capital investments, or cost restructuring, this metric offers a real-time view of core profitability.
For example, when assessing a new business line, compare projected operating income against historical performance. If the new venture maintains or improves operating income margins, it signals operational viability. In contrast, declining figures may warrant a reassessment of strategy.
Operating income should be prioritized when non-operating items might distort other metrics, allowing decision-makers to focus on core business activities.
Communicating Operating Income Insights to Stakeholders
Effectively communicating operating income insights is vital for engaging executives, investors, and board members. Tailor reports to highlight trends, year-over-year changes, and performance drivers relevant to each stakeholder group.
Visual storytelling—using charts, dashboards, and infographics—can make complex data more accessible. For instance, a quarterly presentation might showcase operating income growth alongside key initiatives that contributed to those results.
Clear communication fosters transparency and builds trust, ensuring stakeholders understand how operating income supports broader organizational goals.
Operating Income and Business Growth Strategies
Leveraging operating income is crucial for funding growth, managing debt, and pursuing mergers or acquisitions. Strong operating income signals a healthy business and attracts investors or lenders.
Companies often reinvest positive operating income into product development, market expansion, or technology upgrades. In 2025, trends such as digital transformation and strategic M&A will continue to shape the financial landscape. For an in-depth look at these trends, explore the Financial Outlook 2025: Trends and Topics.
By aligning growth strategies with operating income performance, organizations can make informed decisions that maximize long-term value.
Navigating Regulatory and Tax Implications
Operating income also plays a key role in compliance and tax planning. Accurate reporting ensures alignment with evolving regulations and transparency in financial disclosures.
Organizations must stay informed about changing tax laws and reporting standards that may impact the calculation and presentation of operating income. Regular reviews and collaboration with tax advisors can help identify opportunities for optimization while mitigating risks.
In 2025, proactive management of operating income reporting supports both regulatory compliance and strategic tax planning, positioning businesses for sustainable success.
As you dive into the intricacies of operating income and sharpen your profit analysis for 2025, remember that understanding financial history is a powerful advantage. By exploring how past market events and trends have shaped performance benchmarks, you can spot patterns and make more informed decisions. If you’re passionate about unraveling the stories behind the numbers and want to be part of a platform that puts history at your fingertips with interactive tools and AI-driven insights, I invite you to Join Our Beta and help shape the future of financial analysis.